

I recently published an article about trading using the Trend Level Signals alongside RSI and support/resistance. Some of the readers emailed asking a very good question. “How do you identify a trend?”
While most top traders have mastered the art of trend identification simply by looking at the price chart, beginner traders find it difficult.
So for the sake of traders who find trend identification difficult, I’ve decided to write this detailed guide. I hope it helps.
Trends are relative
Generally, an uptrend is identified when prices have higher – highs and higher – lows. Downtrends on the other hand have lower – highs and lower – lows.
But trends do not form uniformly. They will have periods of price consolidation. For example, during an uptrend, you’ll find ranges where the prices form lower – highs and lower – lows.
These range from support and resistance levels.
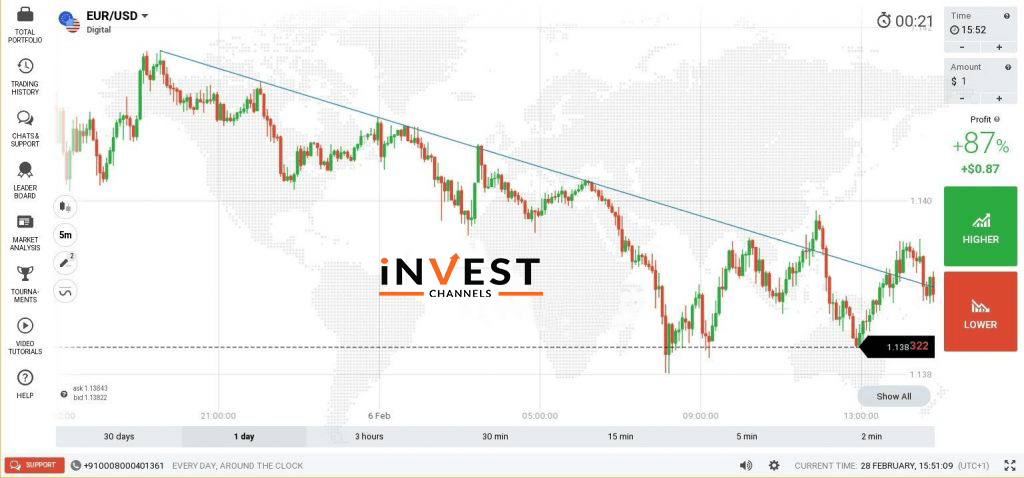
Another thing worth noting is that the ease with which a trend can be identified largely depends on the candle intervals you use. Take a look at the two downtrend snapshots below.
5-minute interval candles
10-minute interval candles chart
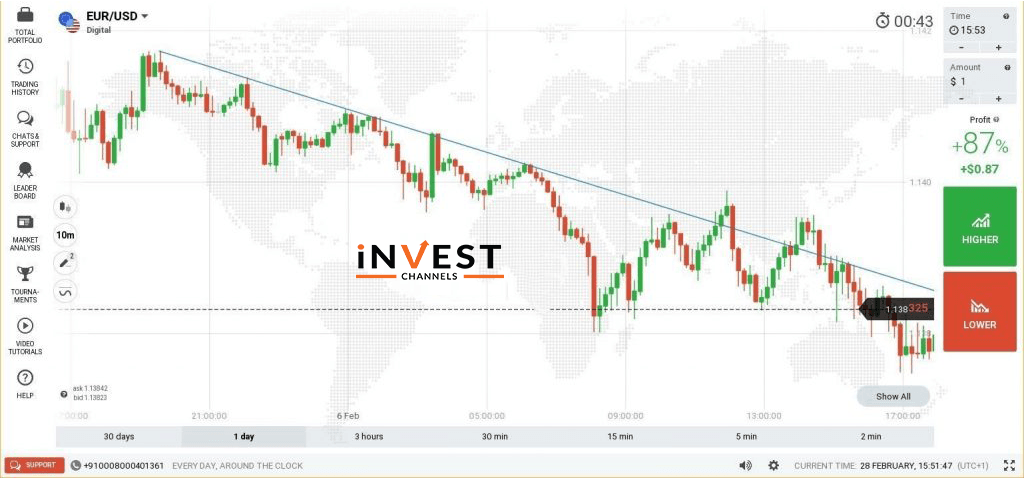
Using these two examples, you’ll find that trend identification is easier when you’re using candles with longer time intervals.
You will also notice that after price consolidation, the price tends to move towards the trend line before resuming the downtrend. These consolidation areas form the support and resistance range.
2 ways to trade using trends on IQ Option
Once you’ve identified a trend, your next step involves identifying the best trade entry points. Remember, always trade along with the trend.
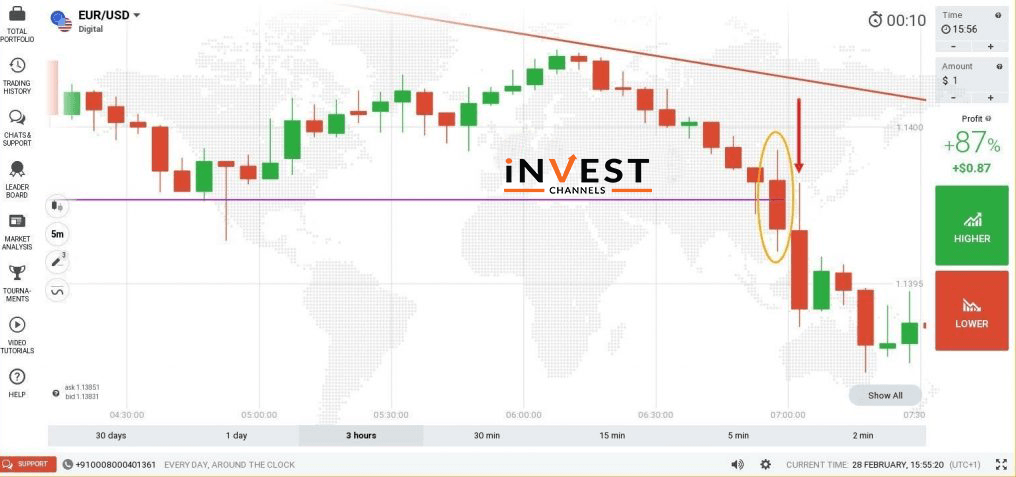
Enter position when price breaks the support/resistance
In the chart below, the price tends to reach the support line (purple) before bouncing up again. The objective is to wait until the prices ultimately break out of the support line. Since the trend is heading down, the trade entry point is when the first bearish candle breaks the support.
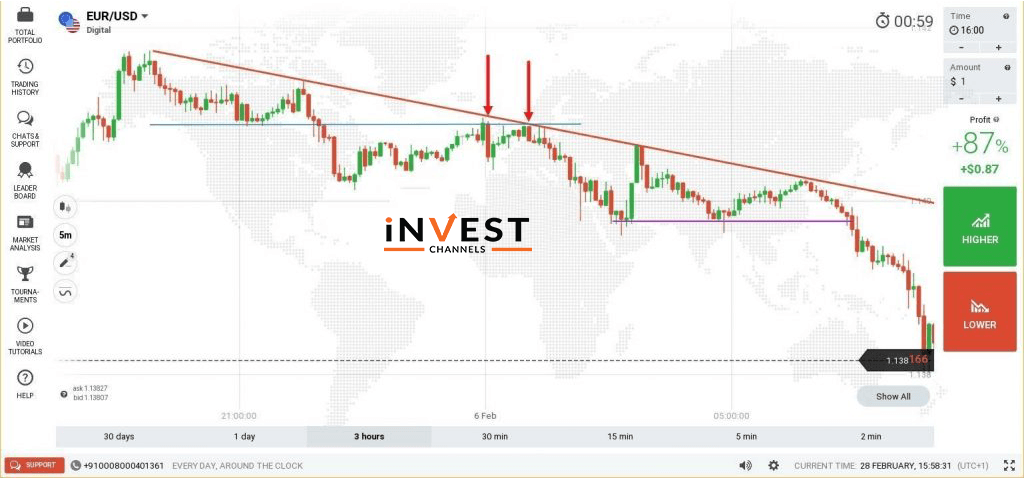
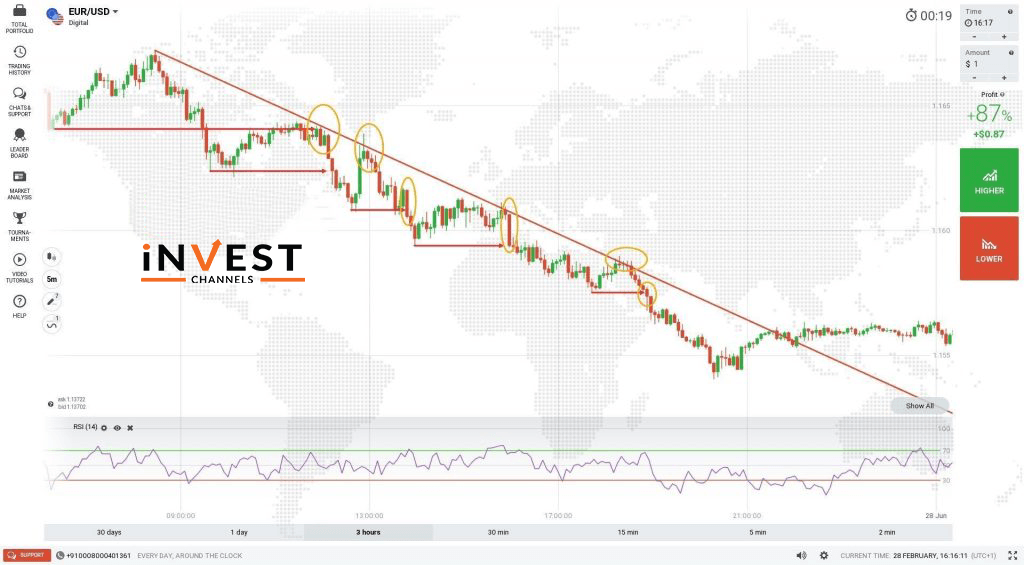
Enter position when the price bounces off support/resistance
In the chart below, you’ll notice that the trend is moving down. However, there’s a price consolidation area. Here, I’ve drawn a resistance line. You’ll notice that the prices immediately start falling right where the resistance line and the trend line intersect. This is a signal that the trend will continue dropping. A good place to enter a sell position.
Examples of possible trade entry points
Let’s use the chart below to find possible trade entry points using TLS.
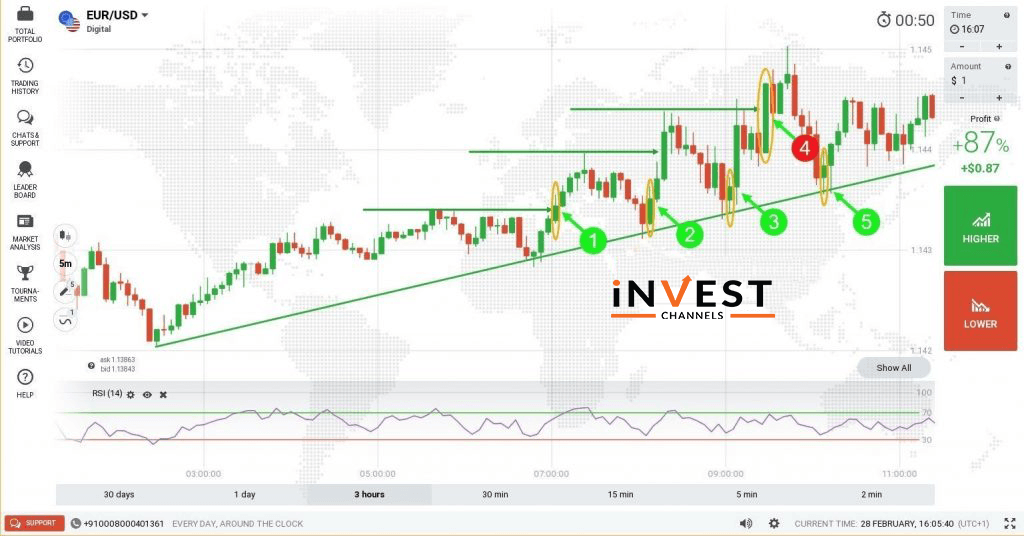
At the first point, two bullish candles have developed right after a bullish pin bar. This is a good place to enter a buy position. Why? Consecutive bullish candles often signal a strong uptrend.
At points 2, 3 and 5, you’ll notice a bullish candle that touches the trend line. This is also a signal for a strong uptrend. Therefore, you should enter a buy position here.
Point 4 is a bit different. The candle doesn’t touch the trend line. Judging from the opening of the bullish candle, it has broken out of the resistance zone created by the candles that form between points 2 and 4. Given that this is the first time the price breaks out of the resistance, I would expect a retracement. The trade here would therefore be a short sell position.
Now take a look at the downtrend chart below. All horizontal lines indicate areas of resistance. Once the price breaks out of these areas, you would expect the downtrend to continue. If you draw a trend line, these break out areas is easier to identify.
Conclusion
Trend identification is an art and a science. If you cannot clearly identify a trend, I’d recommend using longer candle time frames as well as a chart that covers a longer period (3 hours to 1 day).
To clearly chart a trend, connect the high-lows for uptrends and low-highs for downtrends.
After this, all you need to do is identify the support/resistance zones along with the trend. Every time the prices break out of these zones while touching the trend line, it’s a signal that the trend is bound to continue. All you need to do is enter position along the trend direction.
One effective way of trading with the trend is TLS. To learn more about it, the Guide to Trading with the Trend Level Signal to Make $249 is worth reading.

I believe that this guide has taught you how to identify a trend on IQ Options. Use this knowledge to start trading using TLS today. Share your results with us in the comments section below.
Good luck!
You might also want to read


Top 5 Trending

The Norwegian government pension fund has made a significant investment in India's consumer electrical equipment sector, acquiring a 1.7% stake… [Read More]

Introducing DigiToads (TOADS) - The GameFi Token Making Waves in the Crypto Market If you're looking for the next big… [Read More]

Unlocking Profitable Trades: Trade 1-Minute Options with Pin Bar Candles and Bollinger Bands! Looking for a winning strategy to trade… [Read More]

Because of the promising money-making potential, many traders are attracted to binary options trading. Those who are newcomers to the… [Read More]

You will find a variety of features on the IQ Option platform. That is the reason why it is not… [Read More]