Many traders think that the most complicated strategy is the one that works best. However, from experience, simple strategies are the best. The reason is that you don’t need to rely on many different indicators to catch the perfect trade entry point. Besides working with too many indicators can draw you away from your primary objective – making money.

One of the simple and effective trading strategies I use is the rule of 3 candles. That’s my focus in this guide today.
What is the rule of 3 candles strategy?
This strategy is based on candle charts. So you won’t be using line or area charts when implementing it. If you’re new to different types of charts, take a look at these two articles:
Guide to the IQ Option Price Charts
Candle Stick Patterns You Will Come Across When Trading on the IQ Option Platform
The rule of 3 candles strategy uses 3 same-coloured candles that appear consecutively. Use the Japanese candlestick chart. In addition, these are full-bodied candles (or have relatively short shadows). The reason why we use 3 consecutive candlesticks is that they’re more accurate to read than special candles.
Now on the IQ Option platform, your first objective is to identify a trend. If it’s a downtrend, the candles will have red bodies. Uptrends will have candles with green bodies. Along with the trend, you’ll need to identify 3 consecutive candles of the same colour. Once you reach the third candle, your trade should be against the trend because the fourth candle in that sequence is likely to be of the opposite colour.

This strategy’s rules are similar to a coin toss. The first toss produces a 50/50 chance of either heads or tails. If the first toss is headed, the probability of the second toss resulting in heads drops to 25%.
The third toss resulted in heads further drops to 12.5%. As you continue tossing the coin, the probability keeps dropping. That’s how the rule of 3 candles works.
If you get 3 consecutive candles of the same colour, the chances that the fourth will be of the same colour have dropped significantly. That’s why you should enter a trade betting on the opposite colour.
An example of how to apply the rule of 3 candles on IQ Option
You will be working with trends. So, it’s a matter of identifying which candles are dominating at a certain time (green for uptrends, red for downtrends). Ignore the price and only focus on the candle colour.
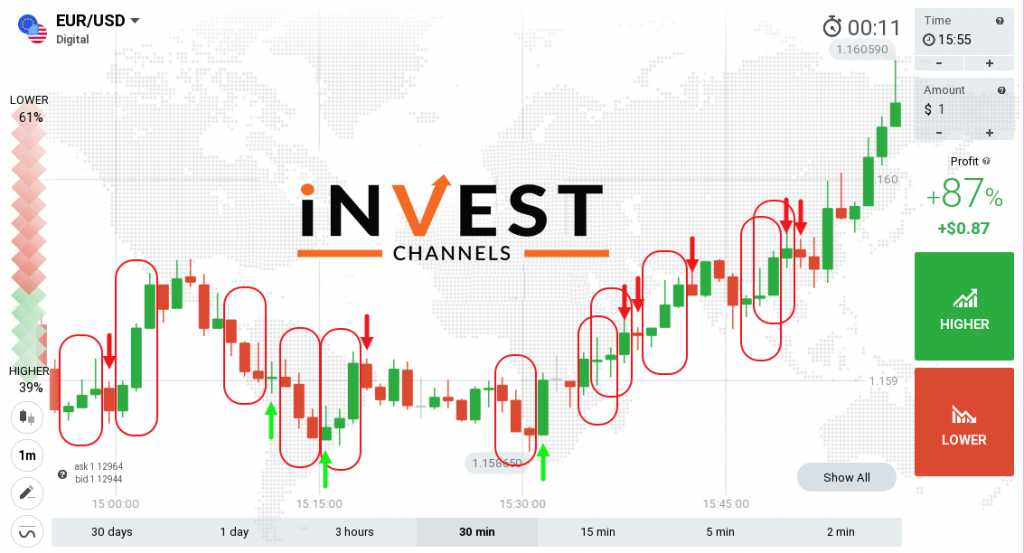
Now, similar to the coin toss, your objective is to predict the colour of the next candle. Since you don’t know exactly what it is, you’ll refer to the previous three candles. If the previous three are red, chances are that the next candle will be green. Take a look at the chart below.

Where to enter your trades: If you have 3 consecutive red candles, your trade entry point is at the end of a candle. That is right when the next candle is starting. As you might have guessed, you should place a higher trade. If there are 3 consecutive green candles, your lower order should come right after the third candle ends.
What if your trade loses? Enter the same order for the next candle. So if you have 4 consecutive green candles your trade entry point should be at the end of the fourth candle. Still, it should be a put order.
Tips for trading using the rule of 3 candles on IQ Option
Before implementing this strategy, you should first analyze the chart’s history. Do you see trends that apply to the 3 candles strategy? It also helps to know if there are upcoming news or events which might affect your currency pair. If there’s any, avoid trading that pair.
Remember that you won’t be following the prices. Rather, it’s the candle colour. Your entry points should be right where the third candle ends and the fourth begins. This means just a few seconds to react.
You might be tempted to increase your trade amount after a losing trade. Doing so might be dangerous. What if the next trade loses? The best thing is to stop trading and analyze the chart looking for the next favourable 3 candle pattern.
Have you traded using the rule of 3 candles pattern? If so, share your experience in the comments section below.
Good luck!
Top 5 Trending
"Why do I keep losing money in trading?" This is a question every trader has asked at some point. Experiencing… [Read More]
Trading indices is more than just a financial pursuit; it's both an art and science, demanding attention to detail, a… [Read More]
Forget Tiffany’s—there’s a diamond that traders treasure even more. Diamond chart patterns may not sit on a ring, but they… [Read More]
The Psychological Line (PSY) Indicator is a versatile, oscillator-type trading tool that compares the number of periods with positive price… [Read More]
Have you ever felt like your trading approach could benefit from a little extra energy? That’s where the Relative Vigor… [Read More]


