One of the most complex indicators offered by IQ Option is the Fibonacci lines. However, once you understand how to use it, it becomes a great tool for trading trend reversals. This guide will guide you teach you about Fibonacci lines and show you how to trade using them on the IQ Option platform.
Overview of Fibonacci Lines lines
Fibonacci lines are horizontal lines that appear on your trading chart when set up. These lines range from 0 to 100. They correspond to the Fibonacci ratios of (23.6) 23.6%, (38.2) 38.2%, (50) 50%, (61.8) 61.8% and (100) 100%. This graphical tool is used to predict possible price retracement areas on the chart (forming support and resistance). These areas are potential trade entry and exit points.
Setting up the Fibonacci lines on IQ Option
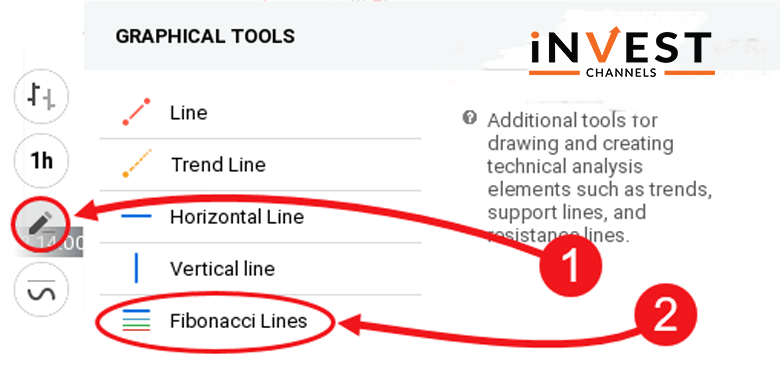
Once you’ve logged into your IQ Option trading account, set up your Japanese candlesticks chart. Next, click on the graphical tools feature and select Fibonacci lines.

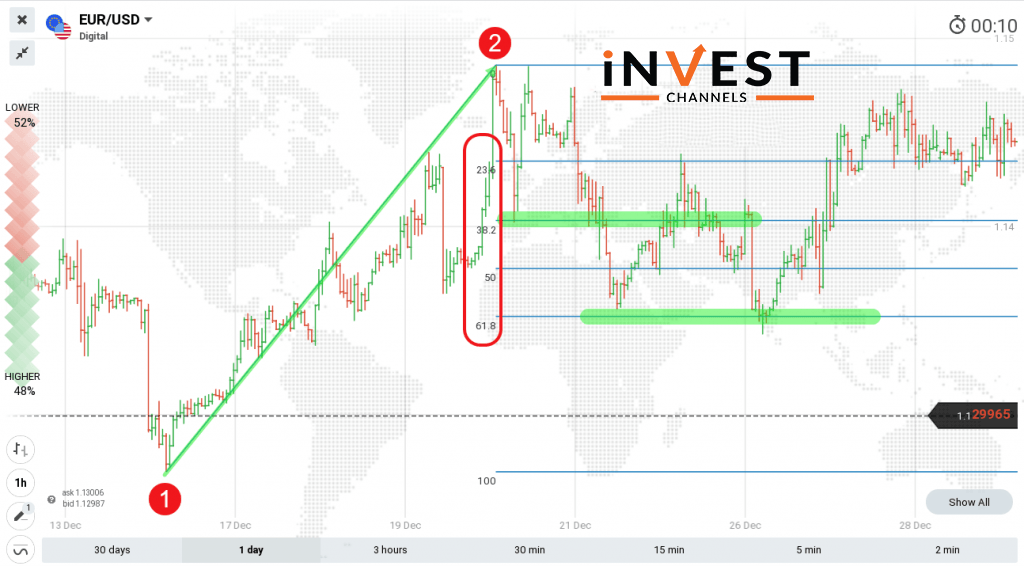
Once you’ve done this, click on the lowest price point on your chart (for uptrend). Then holding the mouse button, drag the cursor to the highest price in the chart. This should apply the Fibonacci lines on your chart. If it’s a downtrend, do the opposite by starting at the highest price point and dragging the cursor to the lowest price point.
Using Fibonacci lines to predict trend retracement
It’s worth noting that trend retracement and trend reversal are two different concepts. Trend reversal occurs when prices move in the opposite direction. Trend retracement on the other hand occurs when the prices temporarily move against the general trend.
This means that once retracement ends, the general trend will continue. During an uptrend, Fibonacci lines will be distributed across the height of the chart.
The lowest line (0) will be at the lowest price point of the period. The highest line (100) will be at the highest price point of the period. All other lines are distributed within this range. Each line, for example, 61.8 marks a price retracement zone.
How to trade using Fibonacci lines on IQ Option
Once you’ve applied the Fibonacci lines, your chart should look like the snapshot below. Your objective is to identify the price retracement zones along with the trend. These zones are perfect short trade entry points. Professional traders usually use the 61.8 zones only.
The reason they believe is that there’s strong buying and selling pressure which increases the probability of price swings. Once the price reaches the retracement lines, it’s time to enter into a trade position.
For example, using the chart below, once prices touch the 61.8 line, you expect them to bounce back and adopt the uptrend. At this point, you should enter a long trade position. Note that the bars in the chart below are 1-hour intervals. So your trade should last anywhere between 1 hour and 10 hours.

Fibonacci lines aren’t that complicated to set up and use as you’ve just seen. Once mastered, they offer a good way to identify price retracement zones. These are good trade entry points. It’s worth noting that Fibonacci lines work best when trading long positions.
So your candle intervals should be at least 30 minutes to get the best results. Now that you know how to set up and use Fibonacci lines, head over to your IQ Options practice account and try them out. We’d love to hear your views in the comments section below.
Good luck!
Top 5 Trending
"Why do I keep losing money in trading?" This is a question every trader has asked at some point. Experiencing… [Read More]
Trading indices is more than just a financial pursuit; it's both an art and science, demanding attention to detail, a… [Read More]
Forget Tiffany’s—there’s a diamond that traders treasure even more. Diamond chart patterns may not sit on a ring, but they… [Read More]
The Psychological Line (PSY) Indicator is a versatile, oscillator-type trading tool that compares the number of periods with positive price… [Read More]
Have you ever felt like your trading approach could benefit from a little extra energy? That’s where the Relative Vigor… [Read More]


