It is a mindset of many traders to make money on IQ Option easily then use the simplest strategy. And these simple strategies include relying on candle colours. First, you should know how to read candle colours by themselves and use one or more indicators alongside.
Keep reading to learn about the use of candle colour with Bollinger Bands to trade on the IQ Option platform.
Setting up Bollinger Bands on IQ Option
Many traders use Bollinger bands as an indicator as it is very popular among them. If you want to learn more about the Bollinger Bands then must-read the Guide to Trading with Bollinger Bands on IQ Option.
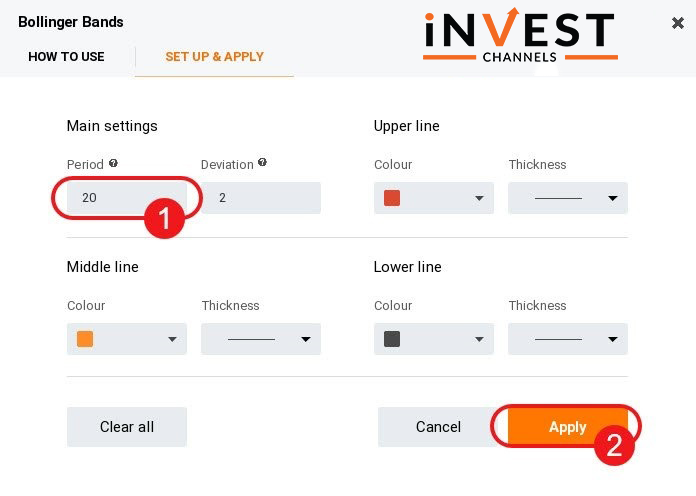
Click on the indicator feature on your interface to set up Bollinger bands and then click on popularly and finally select Bollinger Bands.
The regular period of Bollinger bands is 20 and the deviation is 2. Now do not modify these settings later and keep them as it is on your IQ Option interface.
After setting up, your chart should look like the one below.
How to trade using Bollinger Bands
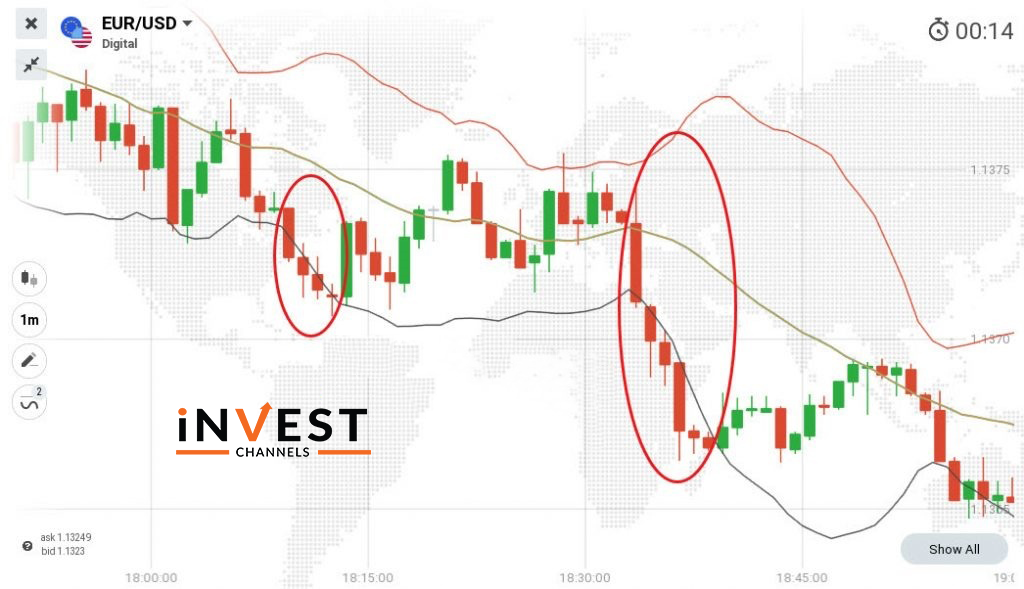
The main objective of yours while using this indicator is to look at where the upper and lower bands cross a candle.
Now if the upper band crosses the green candle that is a bullish candle then it is an uptrend indicator that is expected and if the lower band crosses the orange candle that is a bearish candle then it is a signal of the downtrend that is expected.
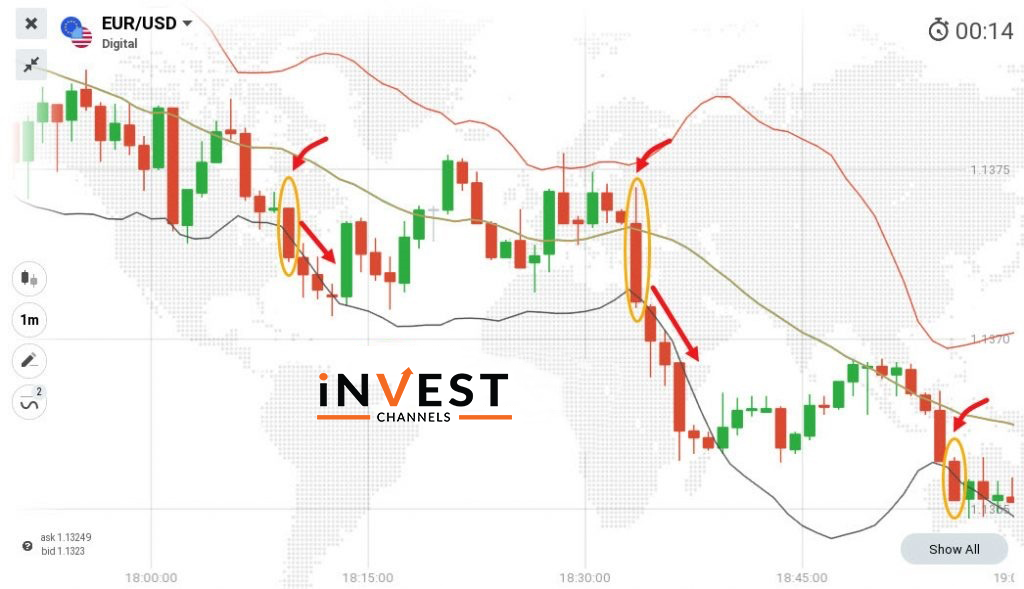
According to the below chart, the lower band crosses a bearish candle and since here 1-minute interval candles is used. the value that will be entered a 5-minute sell position.
Examples of trading candle colours alongside Bollinger Bands
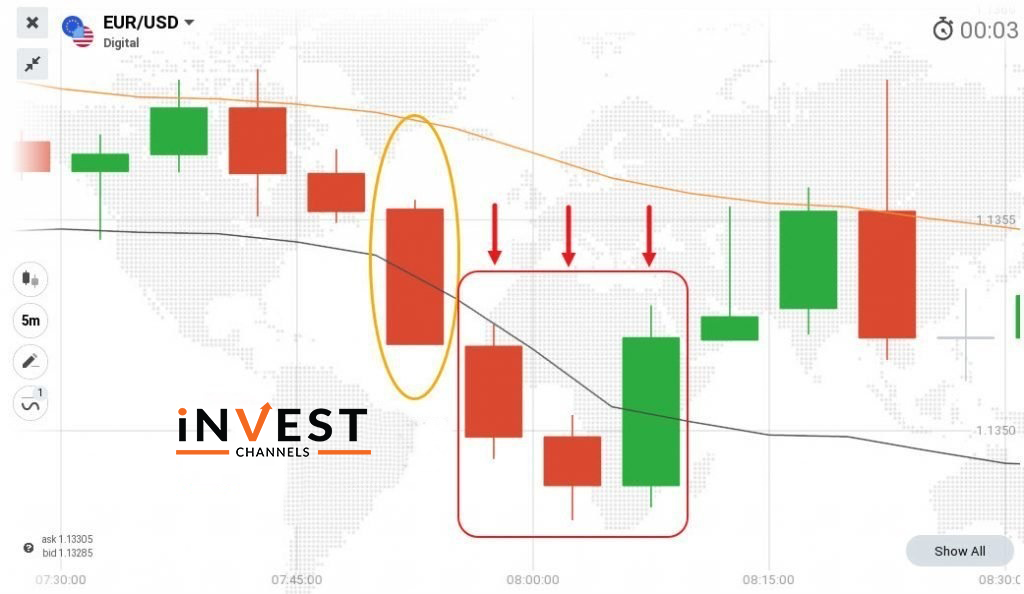
According to the chart, it is a bearish 5-minute interval candle that the lower band crosses. And here the trade entry point will depend on the next bearish candle and the position on trade should last for 5 minutes.
This case will ensure that the trade will close in the money and if instead of 5 minutes, if the position is for 15 minutes then trade would end even. And this is because the bullish candle is at my trade entry point.
Tips for trading using candle colours alongside Bollinger Bands
As discussed the main objective is to identify where the upper and lower Bollinger Band cross the candles. Although, holding a long position depends on the candle time intervals.
Remember that if you are using a 1-minute candle then your trade should last for 5-minutes and on the other hand if you are using 5-minute candles then your trade should also last 5 minutes.
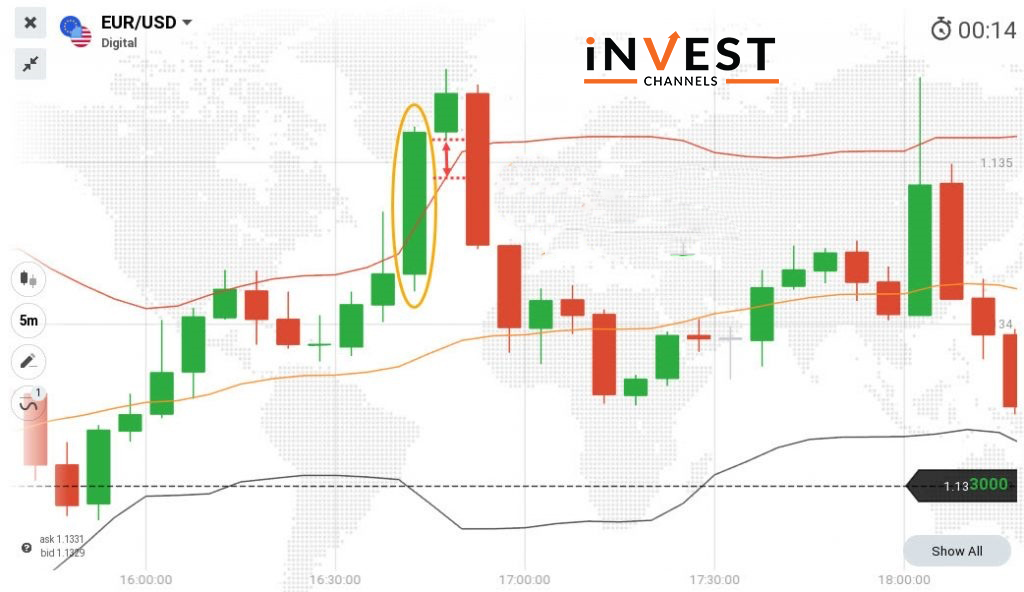
Notice the upper band that crosses a bullish candle and the close of this candle is the entry point. Since the trading is done on 5-minute candles, here the trade should last 5-minutes. And if there was a 10-minutes position, the trade would be unprofitable since the next bearish candle closes lower than my trade entry point.
Using Compounding to trade this strategy
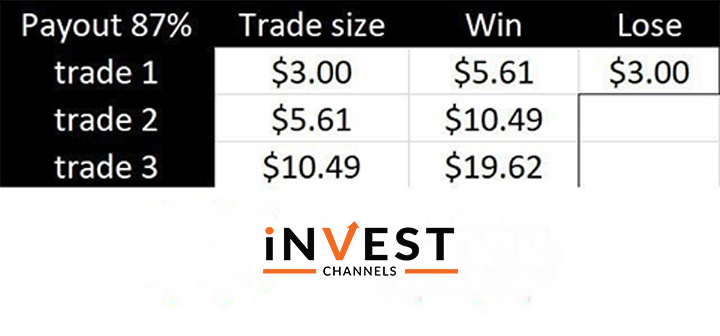
When using this strategy, it is recommended to trade 3% of your account balance as if you have a $100 account balance then the first trade should be only $3.
If you are making a profit through your trade then use your return plus the initial investment in your next trade. So, if you get 3 winning trades then you will get a 20% return.
Trading psychology principles to follow
If you trade using this strategy then you should have a target profit each time. Like, according to the above table, your main goal is to get 20% as a return on your initial account balance and if you reach this target then stop trading.
You should avoid placing two or more consecutive positions based on a single candle as in most cases, once you have entered the position the prediction is correct. There may be a chance to get motivated to enter a similar position based on this. Remember that this strategy depends on the trade entry point.
As we have discussed that trading on Bollinger Bands along with candle colours is one of the simplest strategies to make money on IQ Option. Well, it also requires practice and patience to fully master this strategy and once you get it you will be getting started getting good returns.
Have you traded using candle colours alongside Bollinger Bands? Please share your views in the comments section below.
Good luck!
Top 5 Trending
"Why do I keep losing money in trading?" This is a question every trader has asked at some point. Experiencing… [Read More]
Trading indices is more than just a financial pursuit; it's both an art and science, demanding attention to detail, a… [Read More]
Forget Tiffany’s—there’s a diamond that traders treasure even more. Diamond chart patterns may not sit on a ring, but they… [Read More]
The Psychological Line (PSY) Indicator is a versatile, oscillator-type trading tool that compares the number of periods with positive price… [Read More]
Have you ever felt like your trading approach could benefit from a little extra energy? That’s where the Relative Vigor… [Read More]


