If you see at all trading and market analysis tools, you will find that most traders will agree that Japanese candlesticks are the most important. If you are making any effort on IQ Option without understanding them then it will be like walking in a dark. It is not just about knowing them but using them too. And this is possible only when you will do this by developing a candlestick strategy.
Procedure for Candlesticks strategy
You will need candlesticks anyway, doesn’t matter what security you are trading on. You will clearly see the struggle between the bears and bulls on IQ Option in a very simple way. With help of candlesticks, you can make the right decisions as it will help you understand the market. But only knowing them is not enough. There is a proper way to apply the candlesticks. This way is called the candlestick strategy. Here is how you go about it.
Determine the types of candlesticks you are dealing with
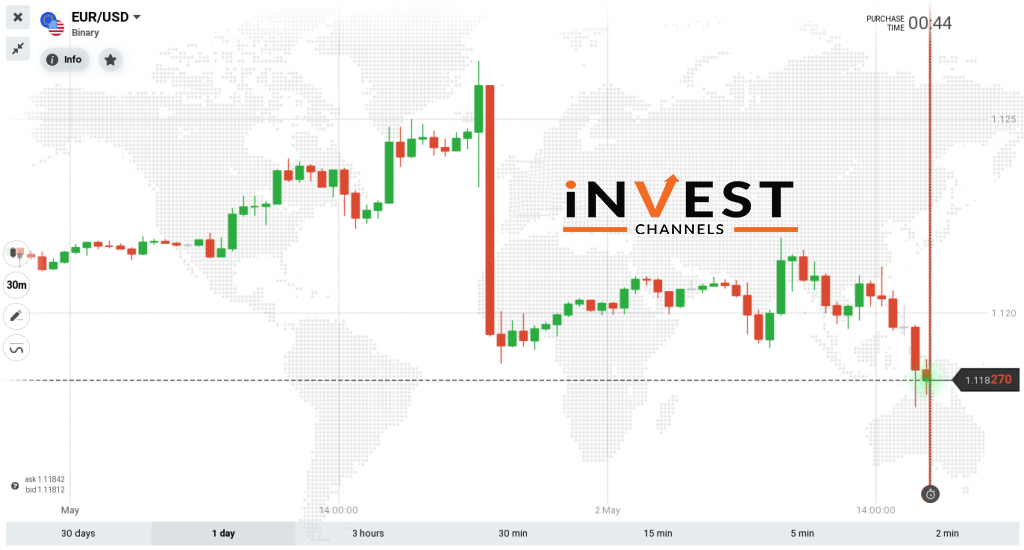
It is the stage where your candlestick knowledge is been tested on IQ Option. At this stage, you need to know everything about candlesticks and at what times in the market they are formed. Since each market is unique, there are many types of candlesticks on IQ Option. In fact, all the charts and candlesticks in the market are different so for this reason you need to know which candlesticks you are working with.
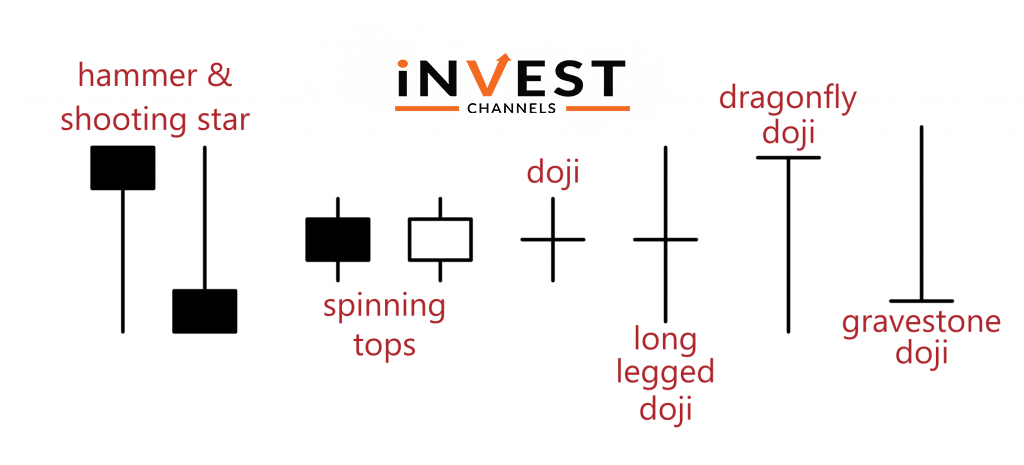
Consider an example, a candlestick in one chart is long while on another chart might be average. A Doji candlestick in one market might mean everything whereas, the same candlestick in another market might be a normal appearance.
Determine the signals.
After identifying exactly which candlesticks you are dealing with in a trade, this step is the next. Note that, act only when the signal is strong enough when trading on IQ Option. It needs to have two characteristics for a candlestick to give off a strong signal. It should have a long shadow or larger than all previous candlesticks on the chart.
Understand the relationship between candlesticks and support/resistance targets.
As we have discussed earlier, candlesticks create significant signals or sometimes insignificant ones that might form at just about any point on a trading chart. One thing about candlesticks of strong signals is that they are usually formed at support or resistant targets and these targets are the points where traders like you join the market to buy or sell. At these points, prices change drastically.
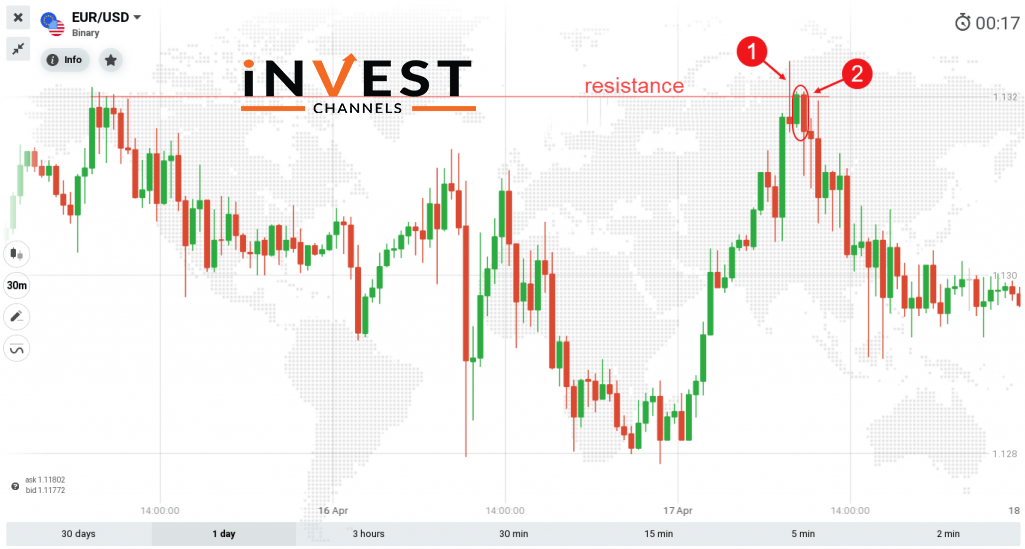
If you want to join the market and make a profit, first you should know the expected direction of change doesn’t matter It will continue in the direction of the market trend or reverse. To get this knowledge, you need to analyse the candlesticks, trends, and signals altogether also, by doing this you will be making the right decisions.

Let the candlesticks close first.
Once you determine the formation of the candlesticks their signal, and the support or resistance targets, you will now have to wait for the candles to close and always remember that this is the most important thing on IQ Option before making this decision. In the end, once the candlesticks are closed they will only give you signals.
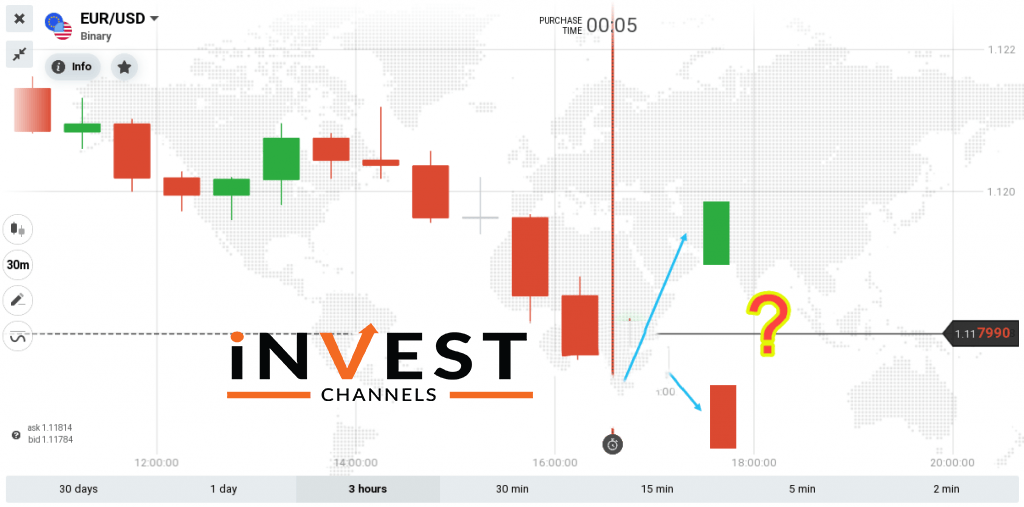
Consider an example, long Dogi candlestick usually starts as a bull but closes when it is short. Remember that a reverse usually happens when the following candle formed is smaller.
Most professional traders insist that for you to increase your chances of making money from trading, you need to have a plan and strategy. Add this one to your list. If you have your own candlestick strategy then go ahead and tell us in the comment section below. For more information check out The Ultimate Guide For Trading Candles On IQ Option.
Top 5 Trending
"Why do I keep losing money in trading?" This is a question every trader has asked at some point. Experiencing… [Read More]
Trading indices is more than just a financial pursuit; it's both an art and science, demanding attention to detail, a… [Read More]
Forget Tiffany’s—there’s a diamond that traders treasure even more. Diamond chart patterns may not sit on a ring, but they… [Read More]
The Psychological Line (PSY) Indicator is a versatile, oscillator-type trading tool that compares the number of periods with positive price… [Read More]
Have you ever felt like your trading approach could benefit from a little extra energy? That’s where the Relative Vigor… [Read More]


