One of the important skills you must develop as a trader is identifying and drawing support and resistance lines. However, Support and Resistance cannot be efficiently used on their own. You’ll need to use an indicator alongside support/resistance to identify the best places to enter a position. One efficient indicator is the Stochastic Oscillator.
This guide will teach you how to use the Stochastic Oscillator alongside support and resistance.
Stochastic Oscillator alongside Support and Resistance
As the price of an asset moves in any direction, there are price points that it doesn’t seem to go past for a while before finally breaking out of these price points. These price points are what traders refer to as support and resistance levels. You can read more on our guide: Support and Resistance, the two best technical indicators that IQ Option players must know.
Now how can you tell that prices are likely to remain within the support/resistance range? And how can you tell how far the price will go before rebounding?
You could try squinting to your chart and try to identify these points manually. But a less strenuous strategy would be using the Stochastic Oscillator that IQ Option provides. We’ve written a more detailed guide, Instructions for using the stochastic indicator to increase the probability of a reversal when trading on IQ Option
How to set up the Stochastic Oscillator on IQ Option
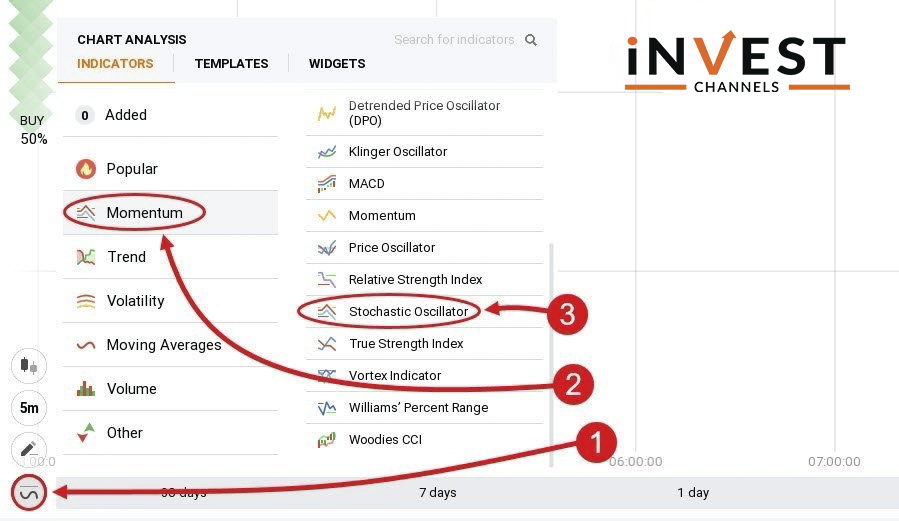
Click on the “indicators” tool at the bottom of your Japanese candlesticks chart. Next, select “Momentum” and then “Stochastic Oscillator”.
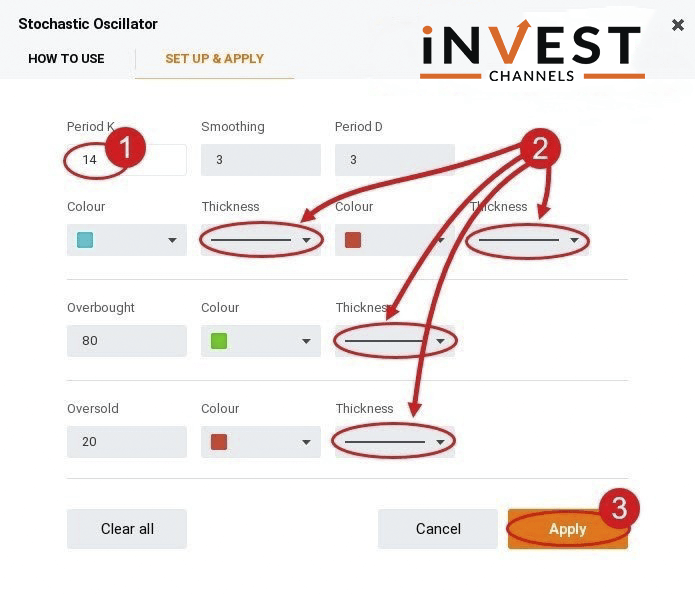
Next, select period K (14) and period D (3) along with their colour and thickness. After this, Adjust the overbought and oversold settings. In this example, I’ll let these remain at 80 and 30. Finally, click on the apply button.
Trading using a Stochastic Oscillator and support/resistance
The Stochastic Oscillator has four lines. The overbought and oversold lines run horizontally and parallel to each other. The other two lines are Period K (blue) and period D (red) lines.
Your objective when using this indicator is to look at the K and D lines’ behaviour when they cross above or below the overbought or oversold lines. When the period D line cuts across the period K line from below while both lines are moving up above the oversold line, make a buy order.
If the period K line cuts across the period D line from above and goes below the period D line. Both lines are moving down under the overbought line, you should place a sell order.
Placing buy order on IQ Option
Place a buy order when the period K line crosses the period D line from under the oversold line.
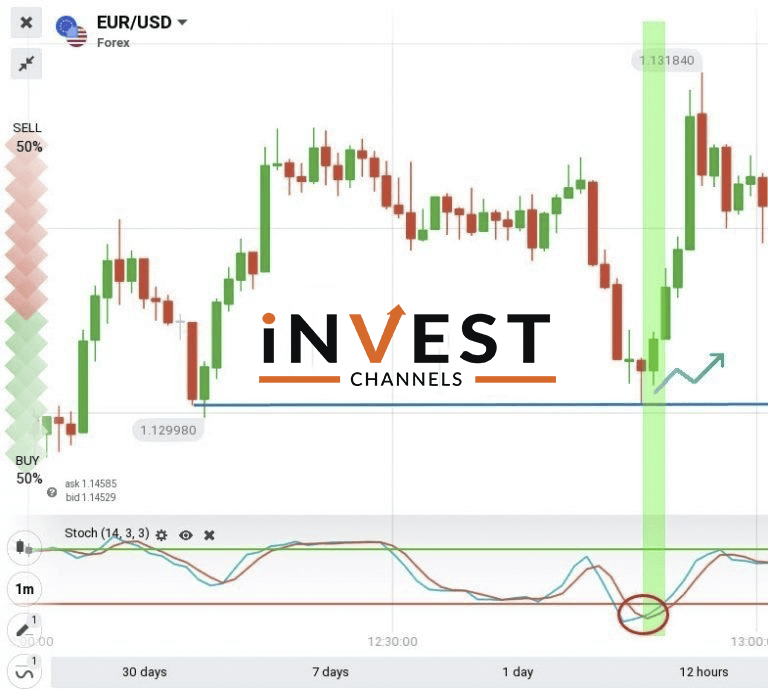
If you’re using support and resistance only you can make money trading the range. However, telling where the price will break the support and resistance can prove difficult. That’s why using the Stochastic Oscillator is so important.
The Japanese candlestick chart you use is also important. If you’re trading 5-minute candles, your chart should be for a 30-minute or 1-hour time frame.
Placing a sell order on IQ Option
Place a buy order when the period K line crosses below the period D line. As both lines move down under the overbought line, these are signals to place a sell order on the IQ Option platform.
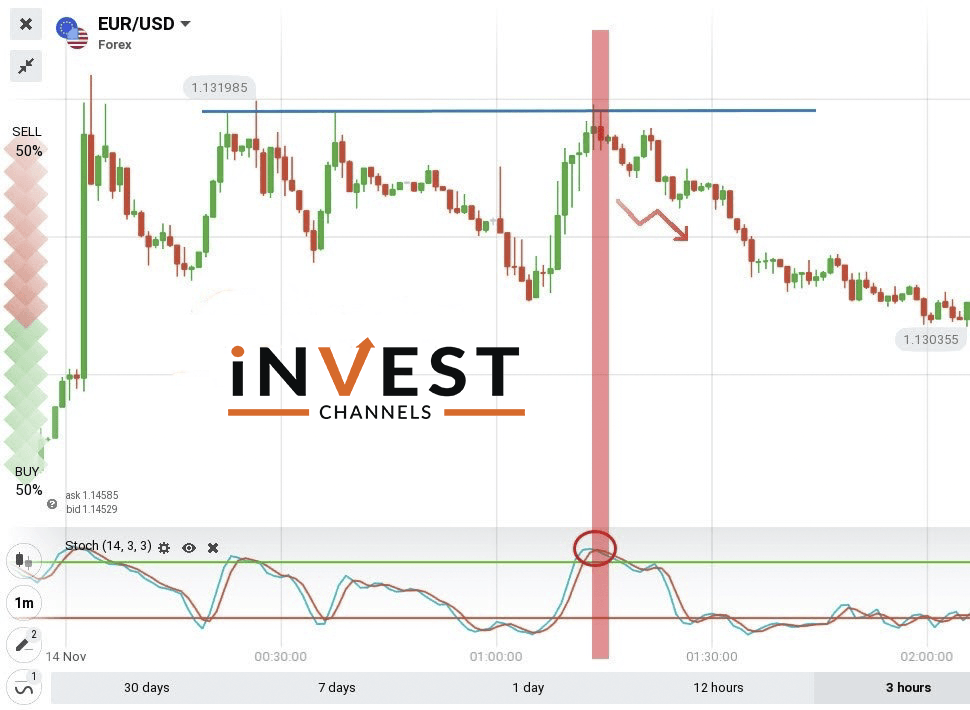
When to enter and exit trades is very important if you want to make money using the Stochastic Oscillator and support/resistance on IQ Option. Immediately the Stochastic lines cross the overbought or oversold lines, you can open long positions. However, if they run within the period lines, your trades should be shorter.
Now that you’ve learned how to use the Stochastic Oscillator alongside support and resistance, try out these tips on IQ Option and share your results in the comments section below.
Good luck!
Top 5 Trending
"Why do I keep losing money in trading?" This is a question every trader has asked at some point. Experiencing… [Read More]
Trading indices is more than just a financial pursuit; it's both an art and science, demanding attention to detail, a… [Read More]
Forget Tiffany’s—there’s a diamond that traders treasure even more. Diamond chart patterns may not sit on a ring, but they… [Read More]
The Psychological Line (PSY) Indicator is a versatile, oscillator-type trading tool that compares the number of periods with positive price… [Read More]
Have you ever felt like your trading approach could benefit from a little extra energy? That’s where the Relative Vigor… [Read More]

