Have you ever felt like your trading approach could benefit from a little extra energy? That’s where the Relative Vigor Index (RVI) steps in—an exciting technical analysis tool that can give your trading decisions an extra jolt.
Just as we feel more alert when things look positive (or after our first-morning coffee), asset prices also tend to close stronger in uptrends. Here’s how the RVI can help you spot these energized moves in the market!
What Is the Relative Vigor Index (RVI)?
The Relative Vigor Index, or RVI, is a momentum oscillator designed to help traders identify the direction and strength of a market trend. This indicator achieves that by examining an asset’s closing price relative to its trading range, then smoothing the data using a simple moving average (SMA).
The unique advantage of the RVI lies in its focus on a fundamental market principle: in uptrends, prices generally close higher than they open, while the reverse happens in downtrends. By honing in on this trend behavior, the RVI provides traders with insights into the market’s momentum.
How Does the Relative Vigor Index (RVI) Work?
When using the RVI, traders will notice that its values rise as an uptrend strengthens. In bullish conditions, an asset’s closing price will typically gravitate toward the top of its trading range, while the opening price sits closer to the bottom.
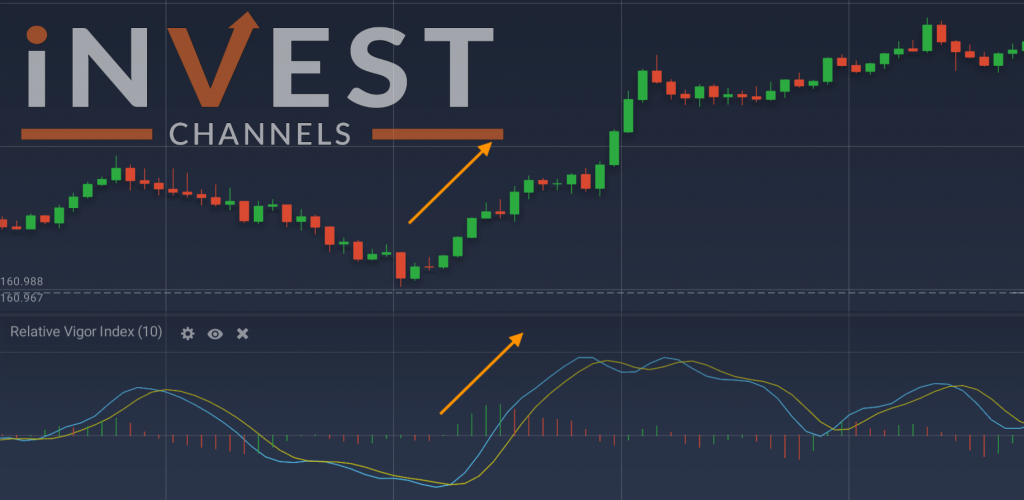
Essentially, when markets are in an uptrend, prices often close on a strong note relative to the opening, while downtrends see prices weakening toward the close.
Similar to other oscillators like the MACD and RSI, the RVI oscillates around a centerline. This means that instead of mirroring price movements, the RVI rotates around a midpoint, often displayed as a separate chart beneath the main price chart. Understanding this separation is essential for effectively incorporating the RVI into your trading strategy.
Developing a Trading Strategy with the Relative Vigor Index (RVI)
There are multiple approaches traders can take with the RVI to gain insights into market trends and pinpoint potential entry points. Two of the most popular techniques are divergence analysis and crossovers. Let’s explore these methods in detail.
Identifying Divergences with the RVI
One of the primary uses of the RVI is to spot divergences, which occur when the RVI and price trends move in opposite directions, signaling a potential trend reversal in the direction indicated by the RVI. For instance, if the price of an asset is climbing but the RVI is declining, this could be a warning of an upcoming price reversal.
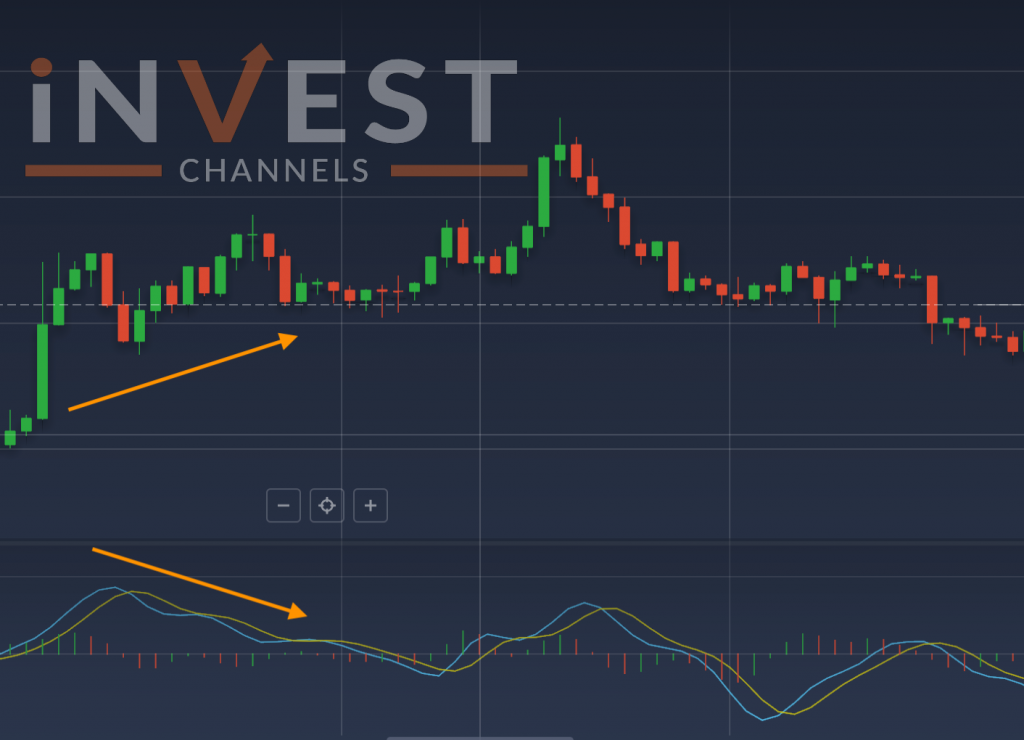
As a leading indicator, the RVI can highlight possible trend changes before they become visible in the price itself. When the RVI’s movements diverge from those of the asset’s price, it often suggests that a trend change is around the corner. This divergence can serve as a valuable heads-up, allowing traders to adjust their positions early.
Using RVI Crossovers
Another popular way to interpret the RVI is through crossovers. When the RVI crosses above or below its centerline, it signals a potential shift in trend direction. If the RVI line moves above the centerline, it indicates a possible uptrend.
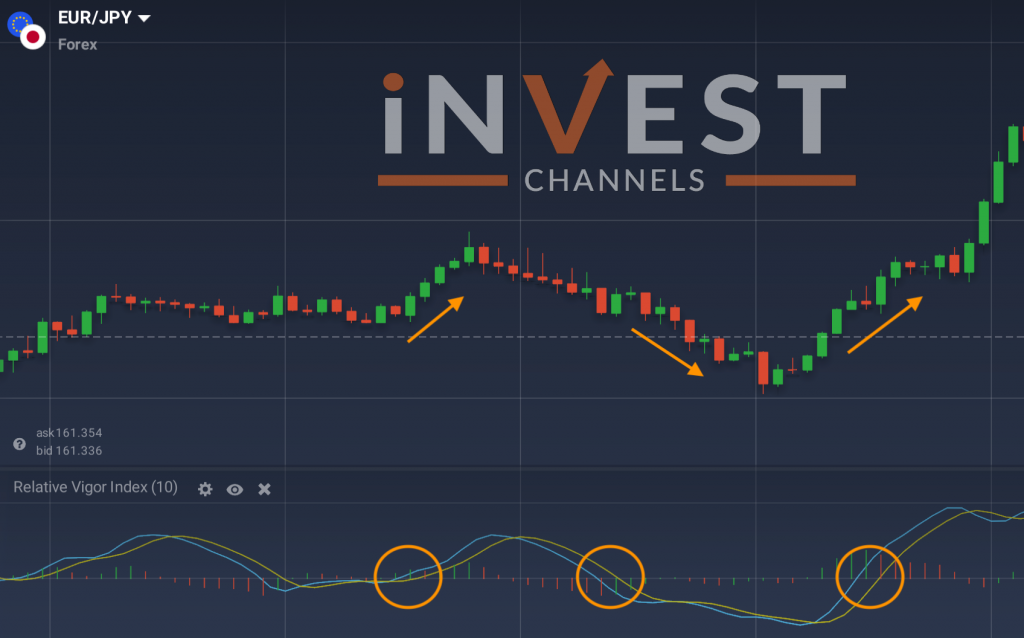
Conversely, if the RVI crosses below the centerline, it points to a bearish trend. These crossovers act as early alerts, helping traders anticipate where prices might move next and allowing them to act accordingly.
By incorporating the RVI into your trading toolkit, you can add extra insight to your analysis, helping you stay ahead of market moves. Whether identifying divergences or tracking crossovers, the RVI provides essential information that can guide your trading decisions and give you greater confidence in your strategy.
Optimal Settings for the Relative Vigor Index (RVI)
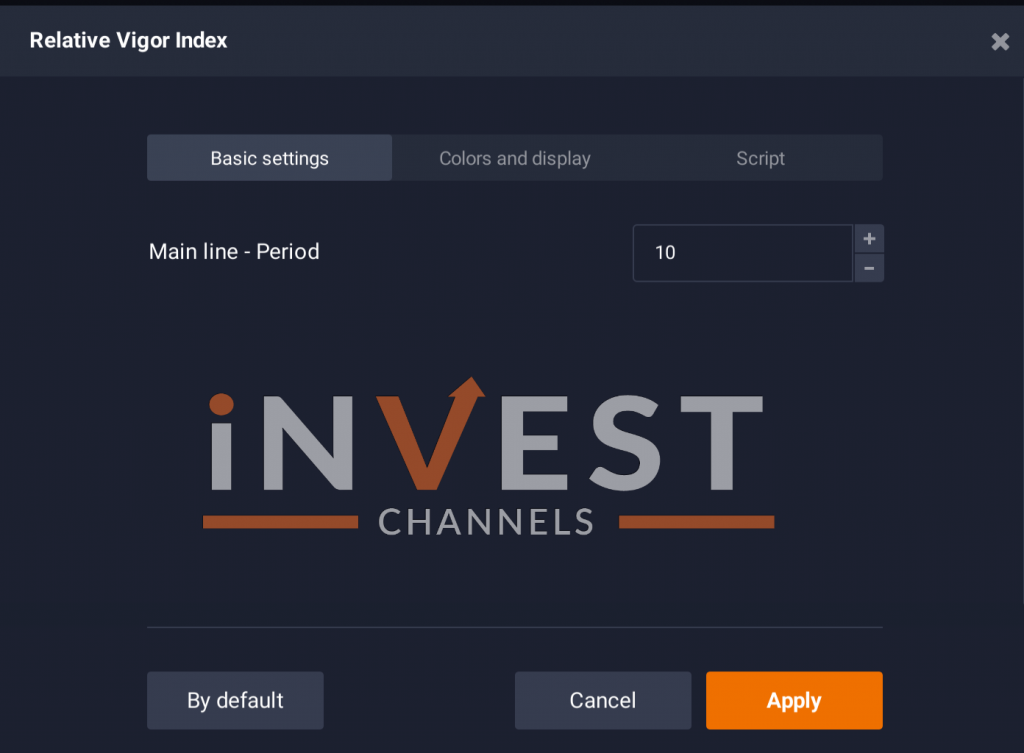
To increase the accuracy of the RVI, traders may consider adjusting the timeframe settings. Extending the timeframe helps reduce the impact of short-term fluctuations, giving the RVI a smoother reading and allowing it to focus on the bigger picture. This adjustment can make the RVI more effective by filtering out market noise and helping traders get more reliable signals.
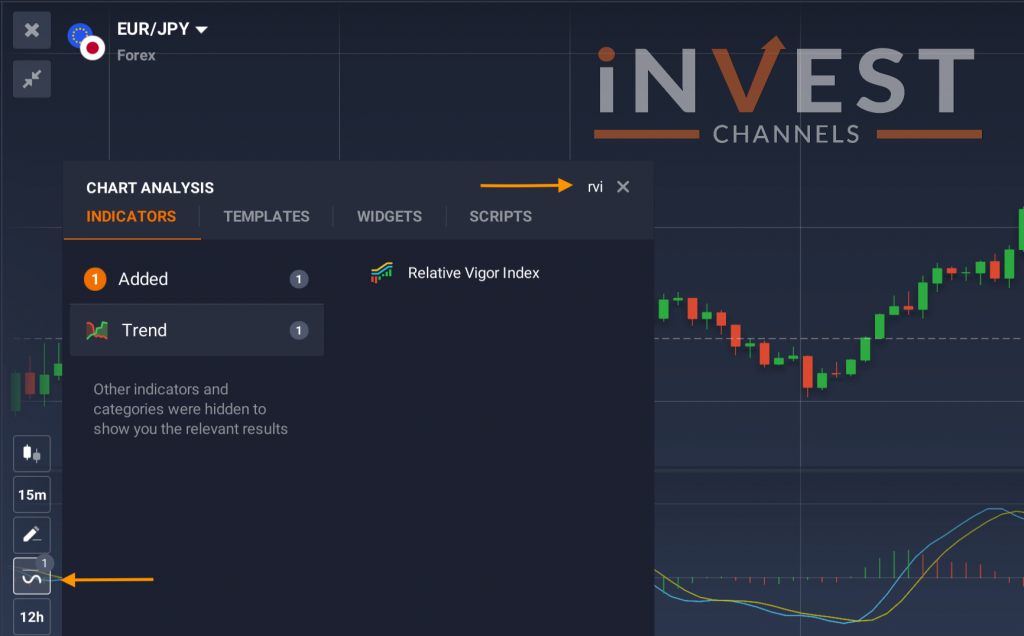
For those trading on platforms like IQ Option, customizing RVI settings is straightforward. Simply access the “Indicators” section, type “Relative Vigor Index” in the search box, and apply it to your price chart. By testing different settings, you can identify the configurations that best fit your trading style.
Relative Vigor Index (RVI) vs. Relative Strength Index (RSI)
Since both the RVI and RSI are part of the oscillator family, they share certain similarities and can sometimes be mistaken for each other. However, they have distinct purposes, and understanding these differences is crucial for choosing the right indicator.
The RSI primarily aims to highlight overbought and oversold conditions, making it especially useful for identifying extreme market levels. The RVI, on the other hand, focuses more on the direction and momentum of the trend, pointing out the prevailing market sentiment. While the RSI assesses the strength of the trend, the RVI helps traders spot bullish or bearish tendencies, making it a go-to tool for capturing the best entry points in line with market momentum.
Combining Indicators for a More Comprehensive Trading Strategy
Experienced traders often combine several indicators to gain a more comprehensive understanding of market movements. By blending multiple technical tools, traders can achieve a clearer and more accurate picture, enhancing their ability to make informed trading decisions. The RVI, when used alongside other indicators like the RSI or MACD, can reveal valuable insights that are not immediately apparent from a single tool.
Take your time experimenting with various indicators to develop a toolkit that works for your trading style. Whether you prefer the RVI, RSI, or a combination of tools, testing different strategies will help you create a unique approach that aligns with your goals and trading preferences.
By exploring the Relative Vigor Index and incorporating it into your strategy, you can unlock new levels of market insight. With practice and a bit of experimentation, the RVI may become an essential part of your trading arsenal—helping you spot trend reversals, anticipate shifts, and navigate the markets with greater confidence.
Top 5 Trending
In the world of online trading — often filled with risk and uncertainty — verifying the credibility of a platform… [Read More]
Starting your trading journey can feel overwhelming — there are countless assets to choose from, and it’s hard to know… [Read More]
"Why do I keep losing money in trading?" This is a question every trader has asked at some point. Experiencing… [Read More]
Trading indices is more than just a financial pursuit; it's both an art and science, demanding attention to detail, a… [Read More]
Forget Tiffany’s—there’s a diamond that traders treasure even more. Diamond chart patterns may not sit on a ring, but they… [Read More]

