
Bollinger Bands are charts just like statistical which characterizes the volatility and prices over time of commodity. Many traders apply these charts as a tool to make trading decisions and control automated trading systems. Bollinger Bands represents the graphical band in a two-dimensional chart.
These Bollinger Band charts can be used in many financial markets such as commodities, forex, equities and futures. In many time frames, Bollinger Band can be used and from very short-term hourly, daily, weekly or monthly.
We know that the bands contract when the market is quite and when the market is loud, the bands expand.
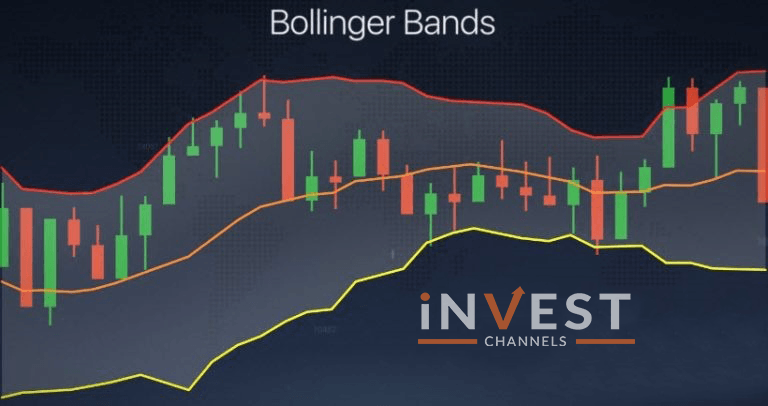
Bollinger Bands are plotted as three lines
- Upper Band
- Middle Band
- Lower Band
SMA i.e. the simple moving average is the middle line of the indicator.
Lower and upper bands represent two deviations below and above the middle line.
How Bollinger Bands indicator is constructed?
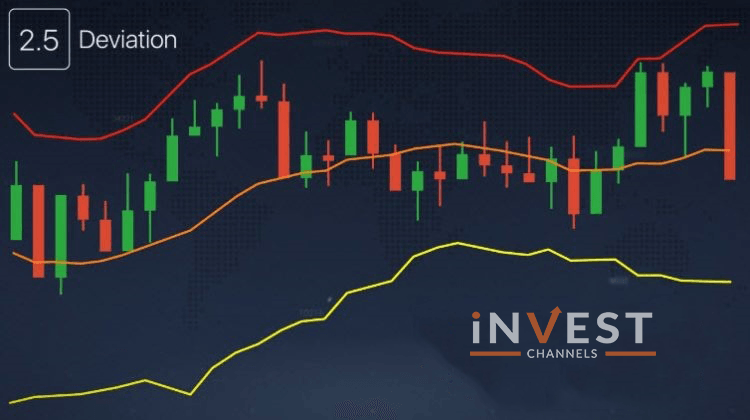
The range of asset price movements is set by the Bollinger Bands. There are three moving averages on the basis of which it is built. One is in the middle and the other two are on either side at the equal distance.
Its coefficient may be set in the indicator settings. The higher the coefficient the wider the range and the more infrequently the chart reaches borders.
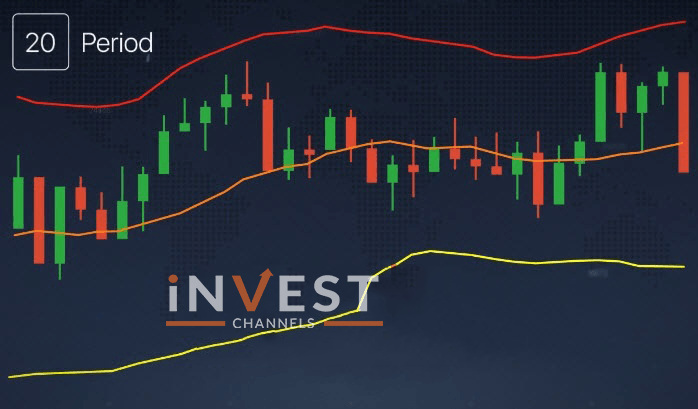
The number of candlesticks is known as a period and it is used to calculate indicator parameters. If period increases it smoothens the corridor but does not guarantee the increase in performance accuracy.
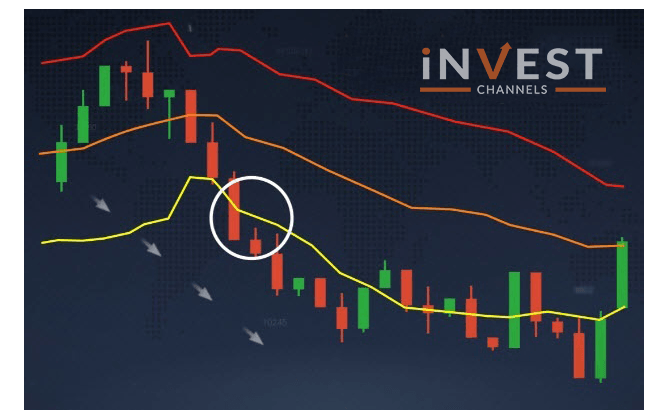
Price behavior and Bollinger bands
When the price approaches or touches one of the lines, the probability of its movement shifts to the opposite direction.
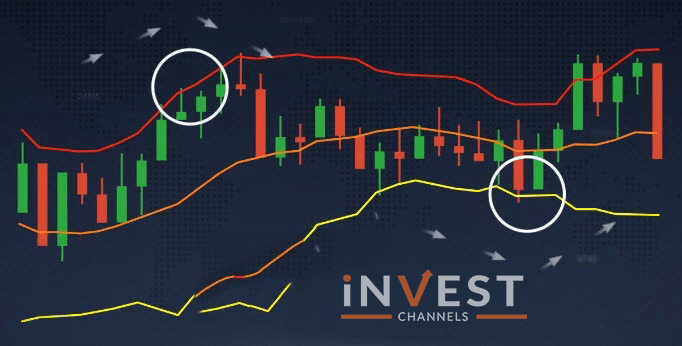
The breakdown of one of the lines signals probable trend movement towards the breakdown.
The higher the volatility on the market the higher the corridor.
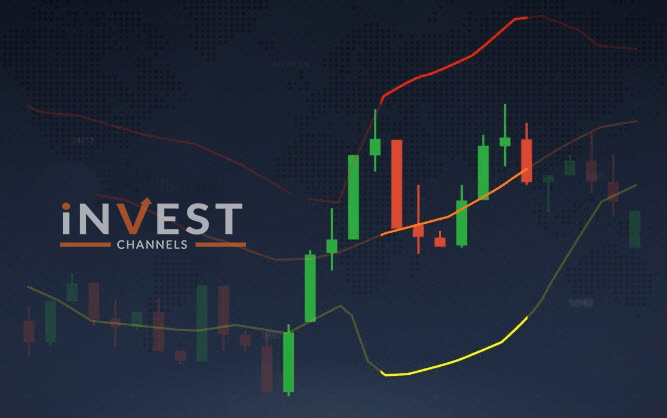
Long term location of the indicator is in a narrow range. Usually preceding upheaval in the market.
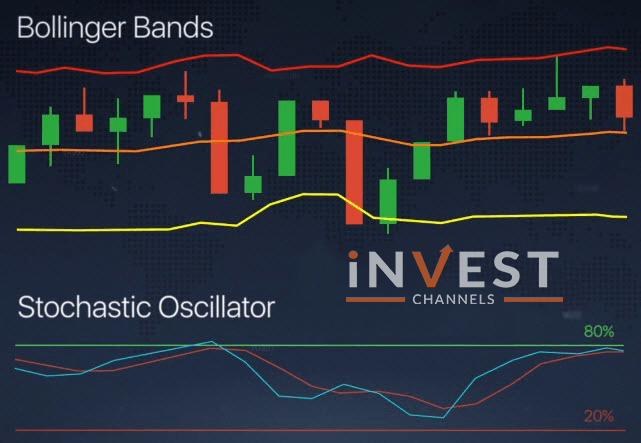
The Bollinger Bands indicator is best used in combination with other indicators. As by the time a strong trend takes place. This indicator alone becomes ineffective.
We highly encourage you to read our guides on how to trade using Bolliger Bands and pin bars and how to combine Bollinger Bands with RSI oscillator.
We wish you successful trading on the IQ Option platform.
You might also want to read

Top 5 Trending

"Why do I keep losing money in trading?" This is a question every trader has asked at some point. Experiencing… [Read More]
Trading indices is more than just a financial pursuit; it's both an art and science, demanding attention to detail, a… [Read More]
Forget Tiffany’s—there’s a diamond that traders treasure even more. Diamond chart patterns may not sit on a ring, but they… [Read More]
The Psychological Line (PSY) Indicator is a versatile, oscillator-type trading tool that compares the number of periods with positive price… [Read More]
Have you ever felt like your trading approach could benefit from a little extra energy? That’s where the Relative Vigor… [Read More]