IQ Option is one of the leading online options and forex brokers. They have invested in many different tools to help traders make money investing in the financial markets. Among these tools are 4 popular price charts. These include the line, bar, Heikin-Ashi and Japanese candles. This guide will provide details of each chart.
How to find IQ Option charts
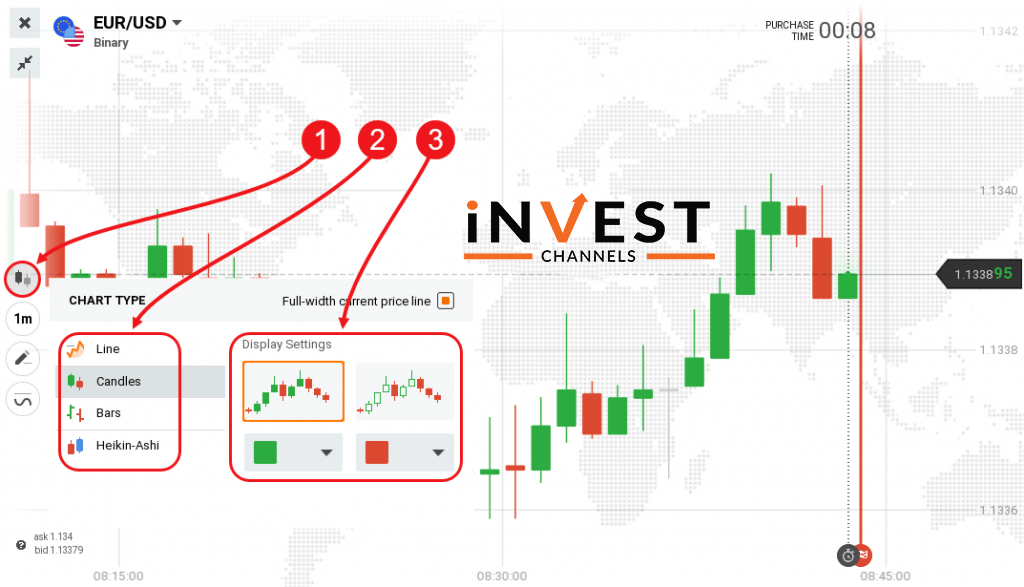
IQ Option charts are located at the bottom left of your chart. Clicking on the symbol of the candle will display all four charts available. All you need to do is select the one that suits your trading style best.

IQ Option Line Chart
This is the most basic chart type. It consists of closing price points connected by a line. They are quite simple to read since you don’t have to worry about complex details associated with advanced charts like the Japanese candles.

Line charts have several advantages. The first is that they are easier to read. This makes it easy to identify important price points such as support and resistance levels. For trend followers, price charts also make it quite easy to identify a developing trend just by looking at the direction the line is taking.
IQ Option Japanese Candle chart
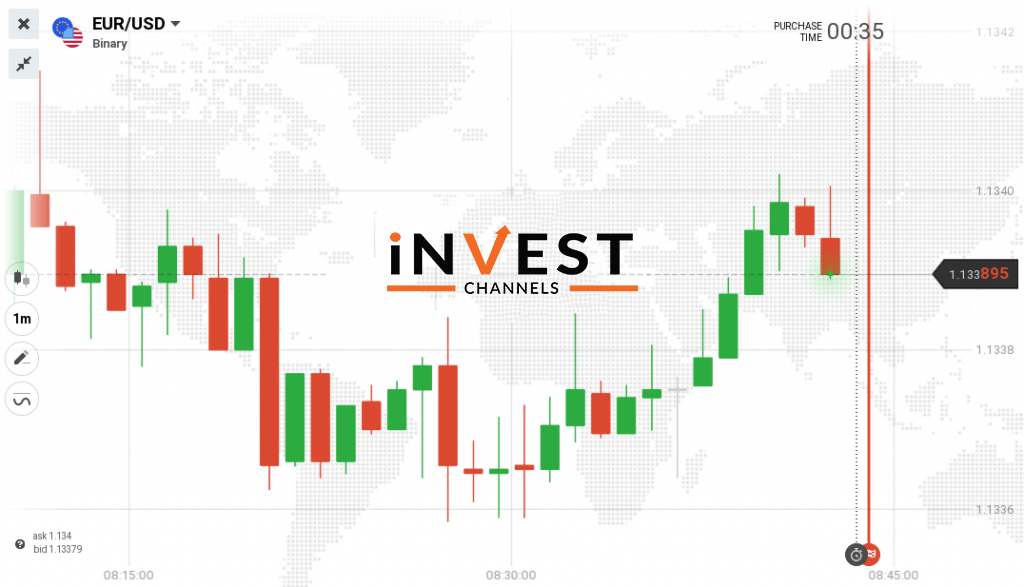
This is a more advanced chart type. It consists of consecutive Japanese candles. Each candle has 4 price points, the opening, closing, high and low of the session. The body of the chart can be hollow or coloured.
Bullish candles are green, while bearish candles are orange on the IQ Option platform. The edges of the candle represent the open and closing prices of the session. Candles can have thin lines on either end. These are called wicks or shadows. These represent the session’s high and low prices.

There are many different types of candles. Each candle has a story to tell about the market conditions. Some will tell you the market is trending or ranging. Others will signal a trend reversal. This makes Japanese candles a popular option for price action and trend following traders. They also work quite well with a variety of technical indicators.
IQ Option Heikin-Ashi chart
This is a hybrid of the Japanese candle. Each Heikin-Ashi candle uses the open and close price of the previous session as well as the open, high, close and low of the current session.
This makes them ideal for highly advanced traders. This chart type works well for trend followers. Unlike Japanese candles, they will filter out any market noise in an effort to better capture the trend.
Besides the trend, Heikin-Ashi candles also help to signal potential trend reversal points.

If you prefer entering long positions and following the trend, this price chart is the perfect one to use.
IQ Option Bar Chart
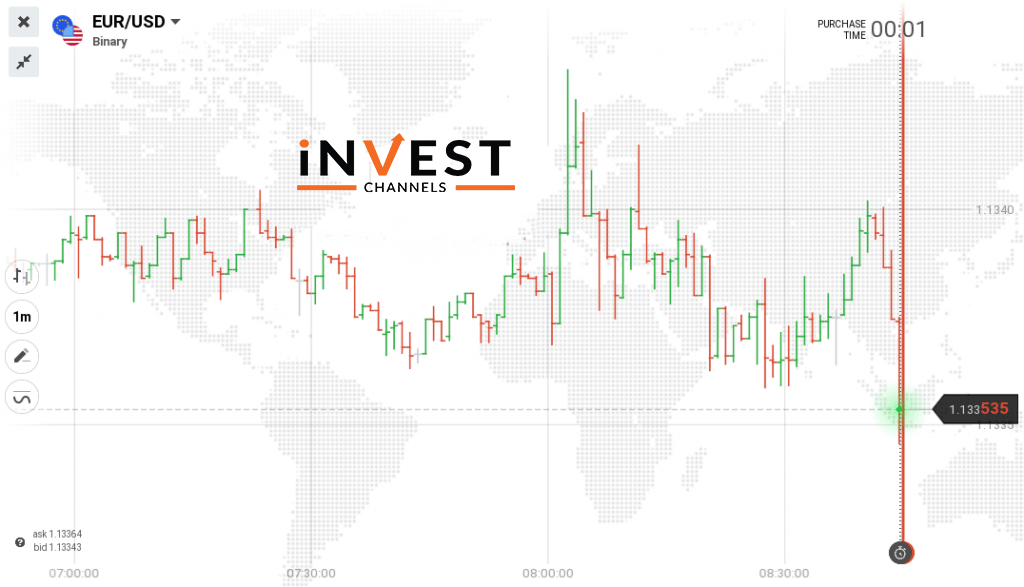
Many traders find bar charts difficult to use. But in essence, they’re quite simple to read. Each bar has four price points (like candles). There’s the open which is represented by the left-facing foot, and the close which is represented by the right-facing foot.
The high and low are the extensions from the body which extend beyond the open and close. Each bar covers a specific time interval. In the chart below, each bar represents the prices over a 1 minute period.

IQ Option Bar chartLike candle charts, bar charts are great for technical analysis. They are easy to view and identify trends and ranges in the market. It’s also quite easy to identify important price points such as support and resistance levels. In addition, they can be used with a variety of technical indicators to get a better picture of the prevailing market conditions.
How do you choose the chart to trade with on IQ Option?
The chart you chose to trade with on IQ Option is largely a matter of personal preference and ease of reading. I suggest you first try out all charts on the IQ Option practice account and see which you’re most comfortable with. Also, remember to find the chart that allows you to make more winning trades.
Good luck!
Top 5 Trending
"Why do I keep losing money in trading?" This is a question every trader has asked at some point. Experiencing… [Read More]
Trading indices is more than just a financial pursuit; it's both an art and science, demanding attention to detail, a… [Read More]
Forget Tiffany’s—there’s a diamond that traders treasure even more. Diamond chart patterns may not sit on a ring, but they… [Read More]
The Psychological Line (PSY) Indicator is a versatile, oscillator-type trading tool that compares the number of periods with positive price… [Read More]
Have you ever felt like your trading approach could benefit from a little extra energy? That’s where the Relative Vigor… [Read More]


