
IQ Option provides you with a handful of indicators to choose from when trading. Two of the most popular indicators are the Bollinger Bands and Relative Strength Index (RSI). When combined, these two indicators for a formidable pair can help you make more winning trades when trading long positions.
This guide will teach you just how to use them on the IQ Option platform.
Using the Bollinger Bands and RSI indicator pair
When trading short interval candles, it’s quite difficult to analyze the true price direction. There are too many price fluctuations to deal with. But if you’re analyzing long interval candles (5 minutes or more) price movements are easier to identify and follow. Combine this with Bollinger Bands and RSI, you stand a good chance of making winning trades.
When trading Bollinger Bands alongside RSI, you will be looking at two things. The first is the price at the upper or lower bands. The second is whether there is divergence on the RSI indicator.
If you don’t understand how to trade using the RSI indicator, Using RSI Indicator to Profit on IQ Option is a guide you should read.
The Guide to Trading with Bollinger Bands on IQ Option will help you get started with the B-Band indicator.
Now back to using these two in an example.
Suppose the price is at the upper band, you would expect that the RSI is near or has even crossed the overbought line. However, RSI divergence occurs where instead of a higher high, it shows a lower high. On the other hand, the price might be in the lower band. But the RSI diverges showing a higher low rather than a lower low.
This is what you’re looking for.
Setting up Bollinger Bands and RSI indicators on IQ Option
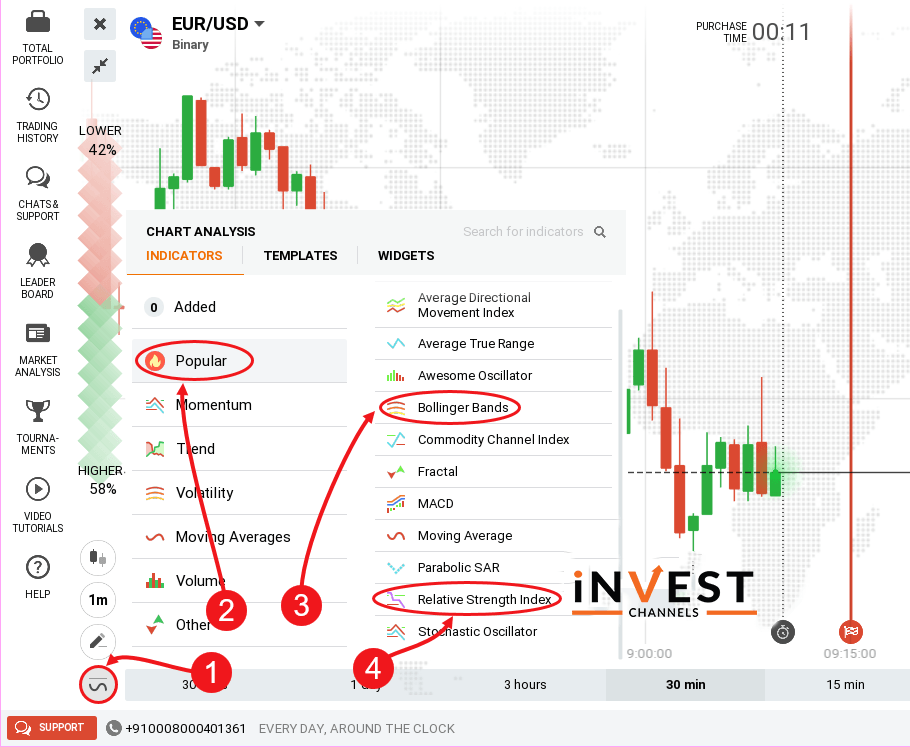
On your Japanese candles chart, click on the indicators feature. Click on “Popular” and start with the Bollinger Bands indicator. Once selected, change the period to 20 and let deviation remain at 2.0. Click apply.
Next, set up the RSI indicator. Let the period remain 14 and click apply.
Trading long positions using Bollinger Bands and RSI indicators on IQ Option
Now with your indicators set, how do you use them to trade on IQ Option? You should look at areas where the prices start ranging. The gap between the band’s narrows. However, the RSI indicator shows divergence. At this point, enter a long trading position.
Entering a long sell position on IQ Option
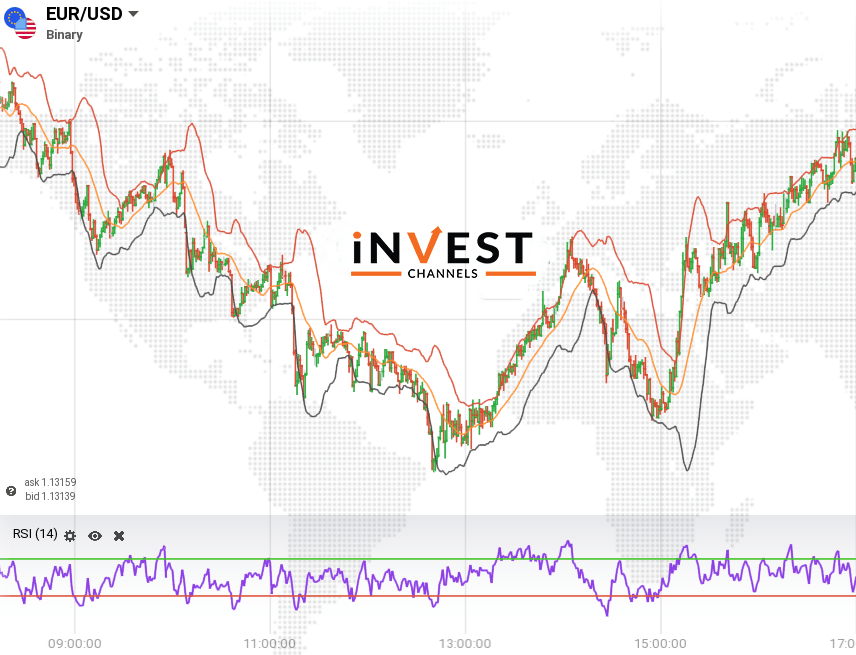
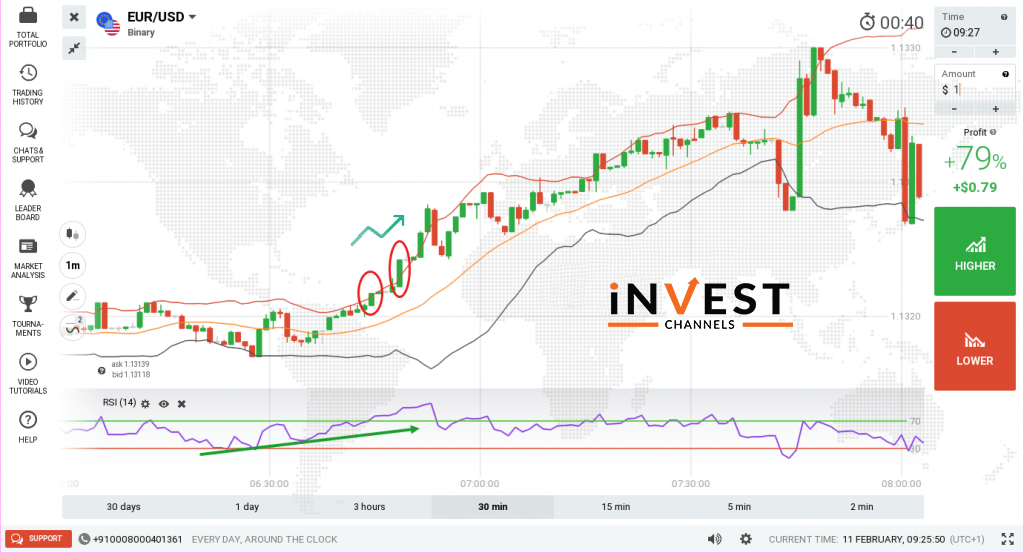
Let’s use the chart below. You’ll notice that the prices are falling within a narrow range. The gap between the Bollinger bands is also narrow. However, looking at the RSI, there’s a bearish divergence where the indicator falls below the 20 lines. This is a signal of an impending downtrend. At this point, you should enter a long sell position.
In this chart, I’m using 1-minute interval candles. The long position opened should last at least 10 minutes to ensure that the trade ends in the money.
Entering a long buy position on IQ Option
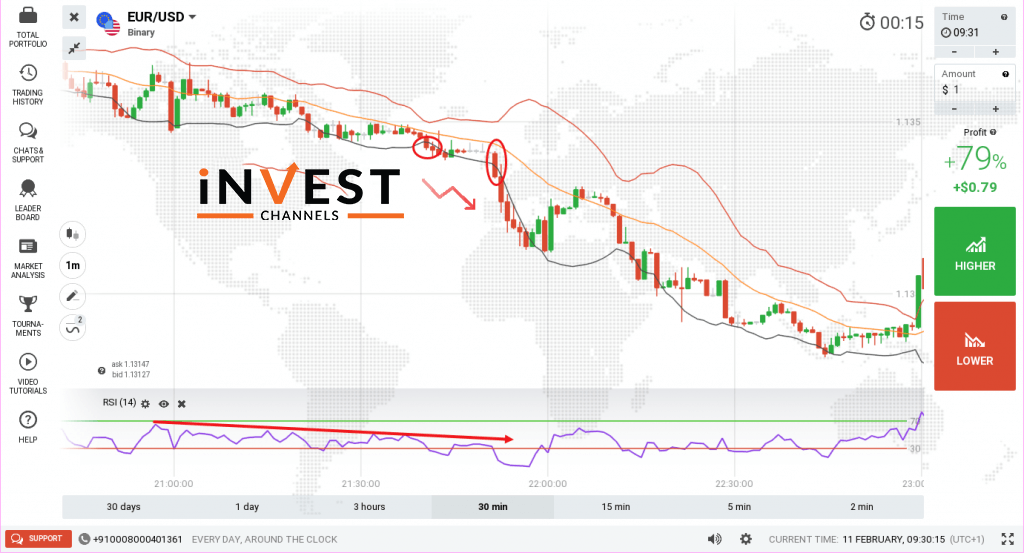
In the chat below the gap between the Bollinger Bands starts to narrow at the end of a downtrend. The prices seemingly drop at some point. However, the RSI indicator has bullish divergence. The line moves towards the 80 lines signalling that the bulls are suddenly stepping in. At this point, you should enter a long buy position.
If you’re using 1-minute candles, your long buy position should last at least 10 minutes.
What to remember when using Bollinger Bands and RSI when trading on IQ Option
Bollinger Bands and RSI indicators should be used to trade long positions only. If you’re using 5-minute candles, you should enter trades lasting at least 30 minutes. This will ensure that your trades will not be affected by price fluctuations that occur when the RSI divergence finally ends and the indicator moves along the prices.
This indicators pair works well in different markets. However, I’d recommend using them in currency pairs markets that are likely to be affected by a news item. Before news items are released, prices tend to consolidate before adopting a sharp trend. It’s during this price consolidation that you’re likely to see RSI divergence.
Always enter a long position and wait for it to end. Avoid trading the price fluctuations that will occur during the trading session.
Good luck!
You might also want to read


Top 5 Trending
In the world of online trading — often filled with risk and uncertainty — verifying the credibility of a platform… [Read More]
Starting your trading journey can feel overwhelming — there are countless assets to choose from, and it’s hard to know… [Read More]
"Why do I keep losing money in trading?" This is a question every trader has asked at some point. Experiencing… [Read More]
Trading indices is more than just a financial pursuit; it's both an art and science, demanding attention to detail, a… [Read More]
Forget Tiffany’s—there’s a diamond that traders treasure even more. Diamond chart patterns may not sit on a ring, but they… [Read More]