
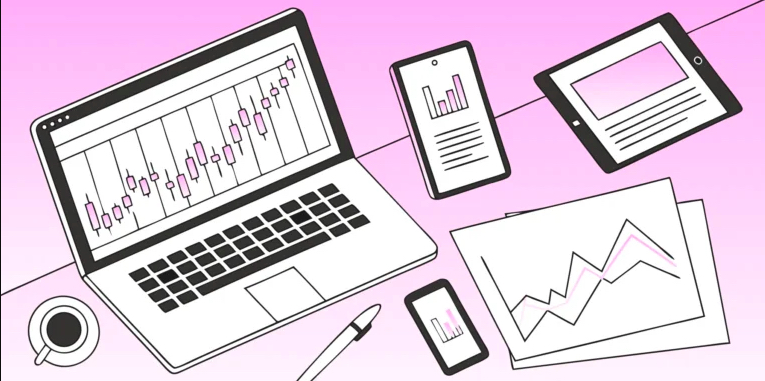
Linear charts
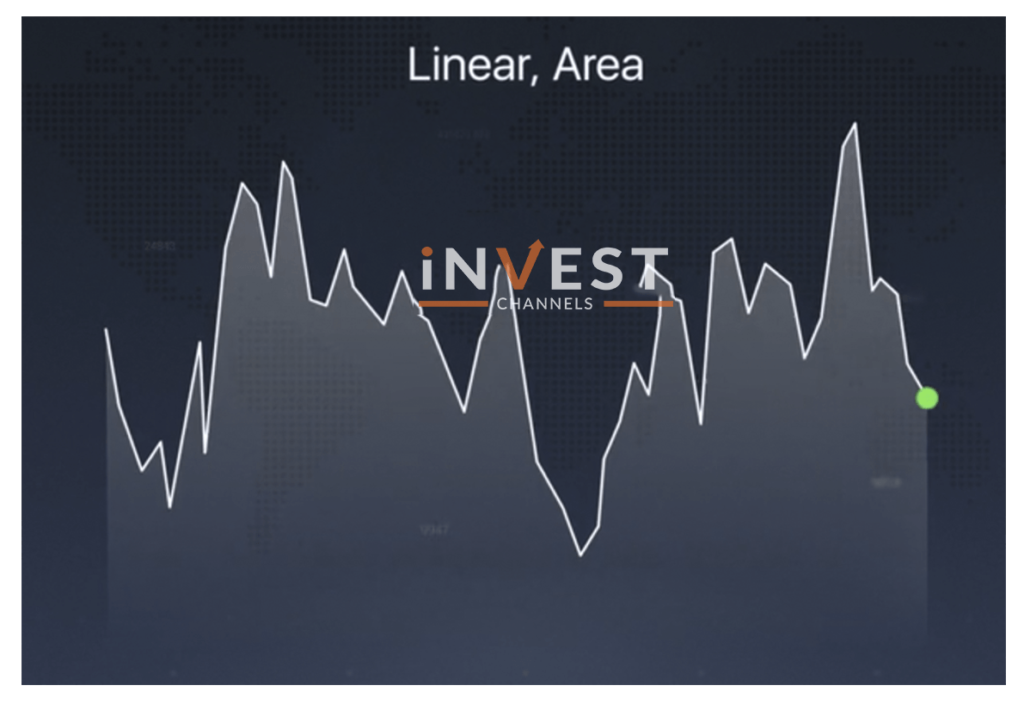
You can represent price movement as a line. Many times, Japanese Candlesticks are used to view charts and for the market situation analysis.
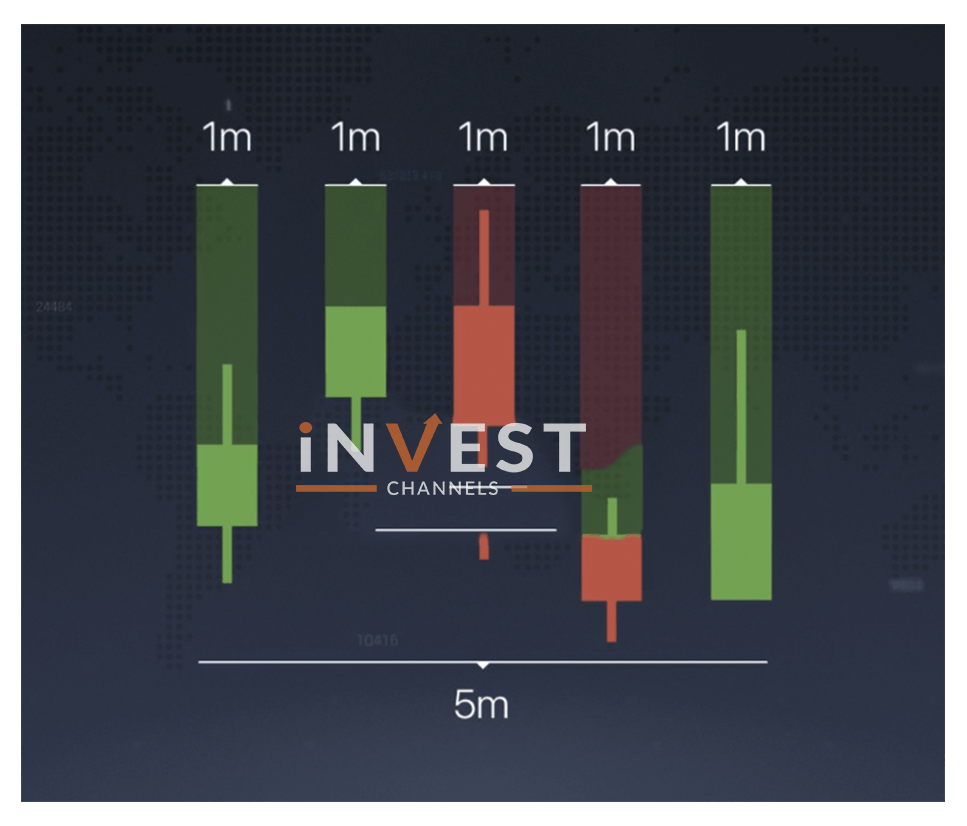
Japanese candlesticks
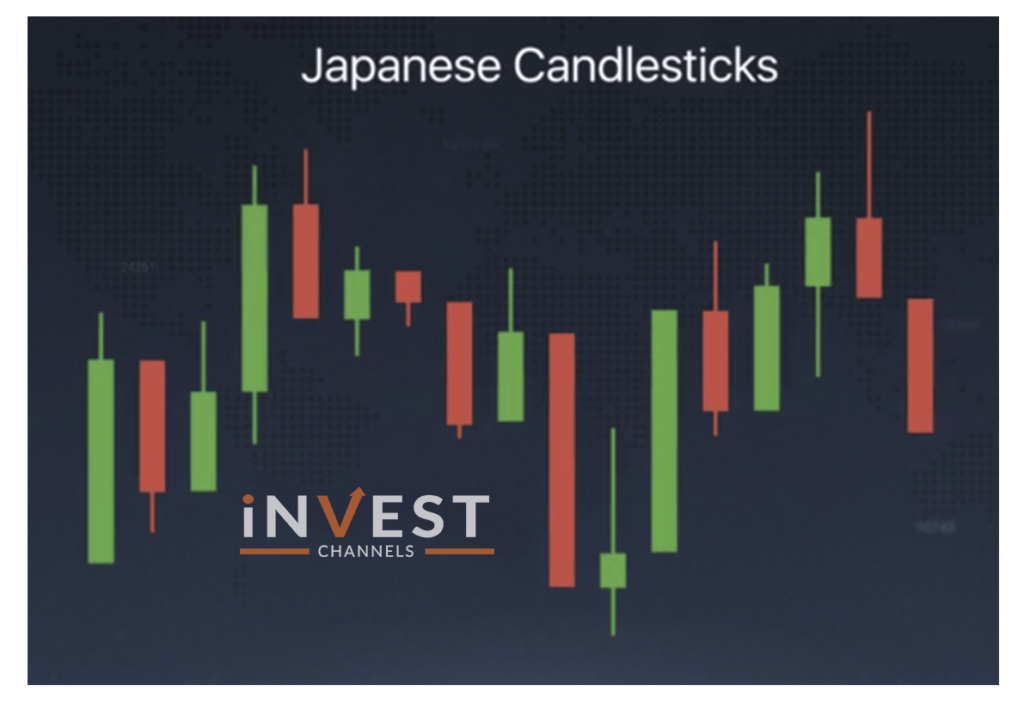
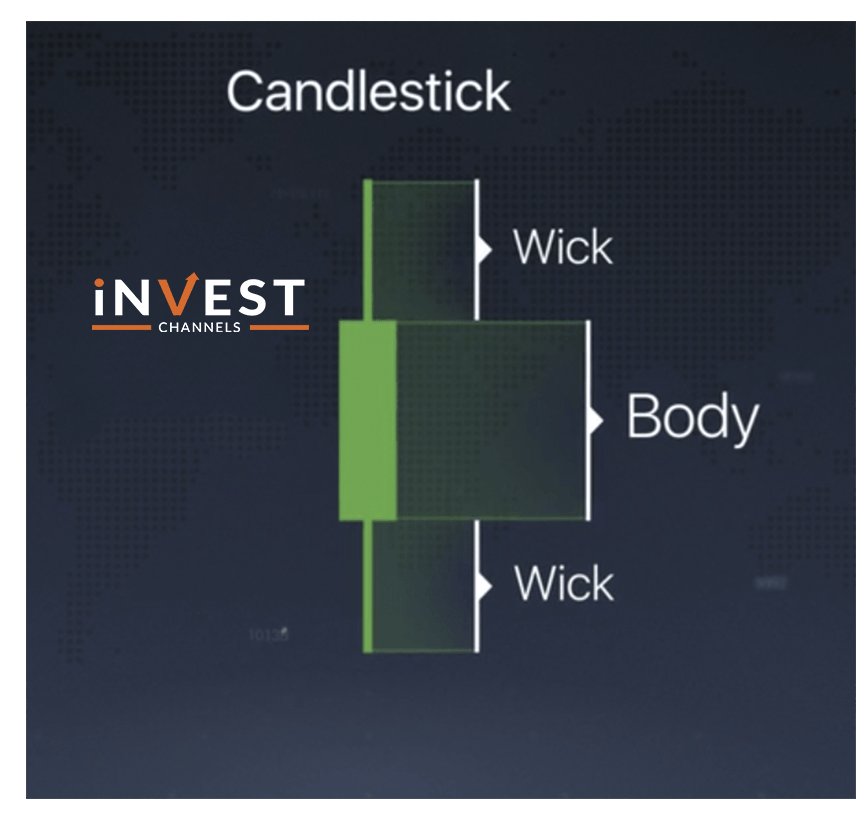
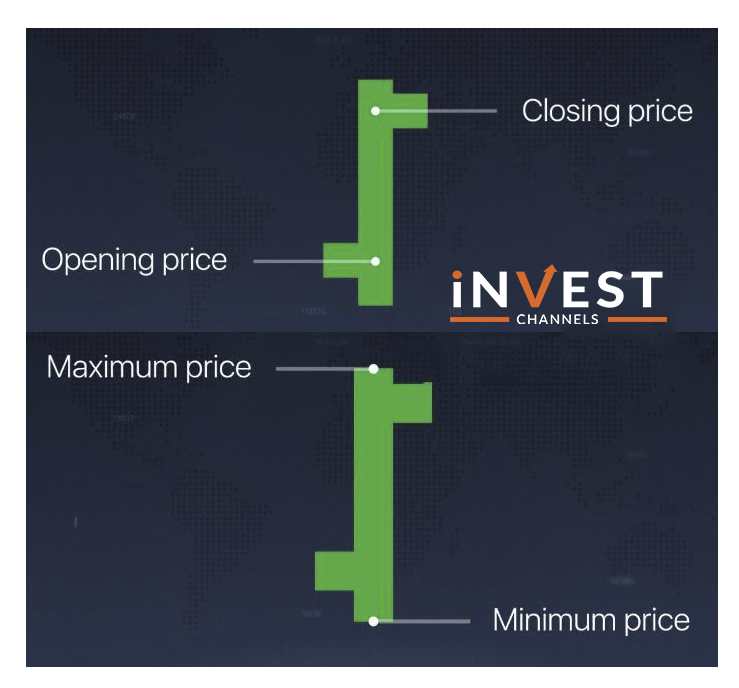
Candlesticks consist of the body and the wick and for a particular period, it contains information on price changes.
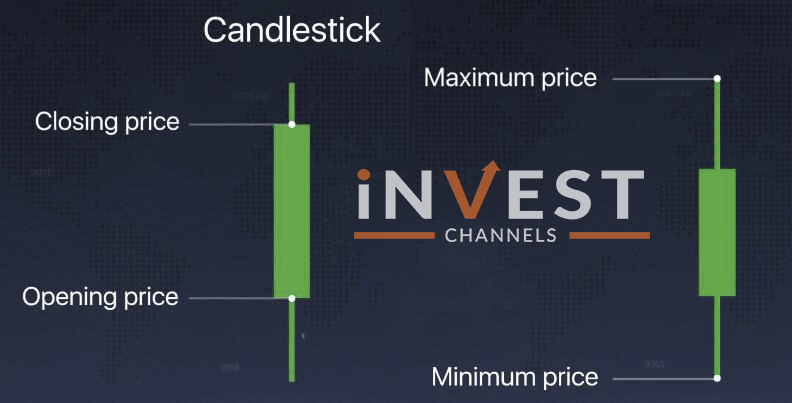
You can see the opening and closing price at the body’s border and for the minimum and maximum price, you can find it at the upper and lower borders of the wick.
You will be notified whenever the price of an asset varies. candlestick will turn green when the price increase and it will turn red when the asset price decrease.
Bar chart
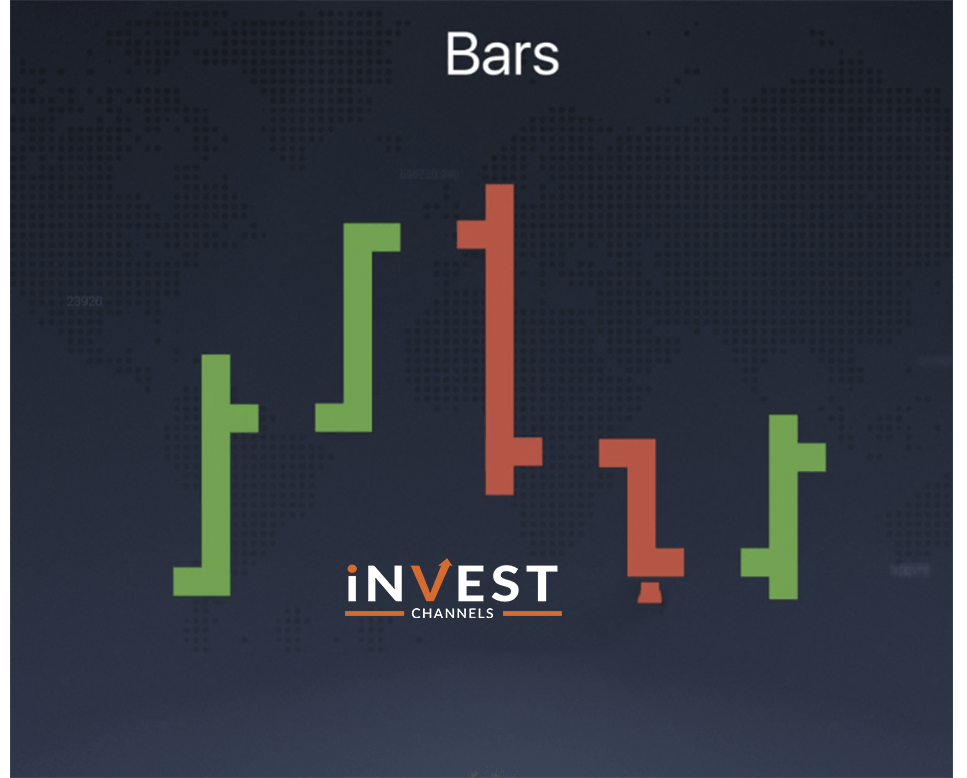
Bars are also created on the same principle as candlesticks. Bars are made of perpendicular and vertical lines where perpendicular shows opening and closing, and vertical lines show the minimum and maximum price.
Why candlesticks are the most popular?
Professional traders are very fond of Japanese Candlesticks. candlesticks hold very depth information with them. It helps traders to get a full-fledged fundamental analytical instrument without which many indicators are not possible.
We wish you a pleasant trading experience.
You might also want to read


Top 5 Trending

In the world of online trading — often filled with risk and uncertainty — verifying the credibility of a platform… [Read More]
Starting your trading journey can feel overwhelming — there are countless assets to choose from, and it’s hard to know… [Read More]

"Why do I keep losing money in trading?" This is a question every trader has asked at some point. Experiencing… [Read More]

Trading indices is more than just a financial pursuit; it's both an art and science, demanding attention to detail, a… [Read More]

Forget Tiffany’s—there’s a diamond that traders treasure even more. Diamond chart patterns may not sit on a ring, but they… [Read More]