
Candle patterns are a good way to read the current market conditions. There are dozens of candle patterns you can use for technical analysis. These can allow you to determine where exactly to enter or exit trades even without using technical indicators. One candle pattern regularly used to determine trend reversal is the Evening Star candle pattern.
This guide will teach you how to identify this pattern. Then, I’ll show you how to trade with it on the IQ Option platform.
How to identify the Evening Star candle pattern on IQ Option
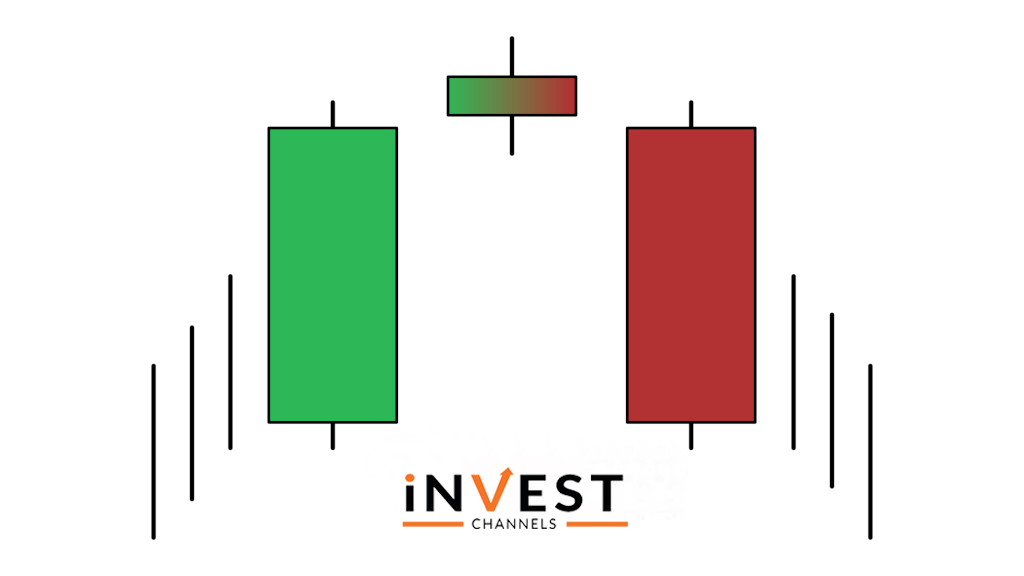
The Evening Star pattern consists of 3 candles. It’s a bearish reversal pattern.
The first candle is a long bullish candle. This shows that the bulls still dominate the market. However, the bullish trend is approaching exhaustion.
The second candle is a small doji or spinning top. In most cases, the high of this session will be higher than that of the previous bullish candle. However, as the prices went higher, the bears stepped in bringing them down.
The third candle is a long bearish candle. This is an indicator that the trend has reversed and the bears are taking market dominance.
How to trade using the Evening Star candle pattern on IQ Option
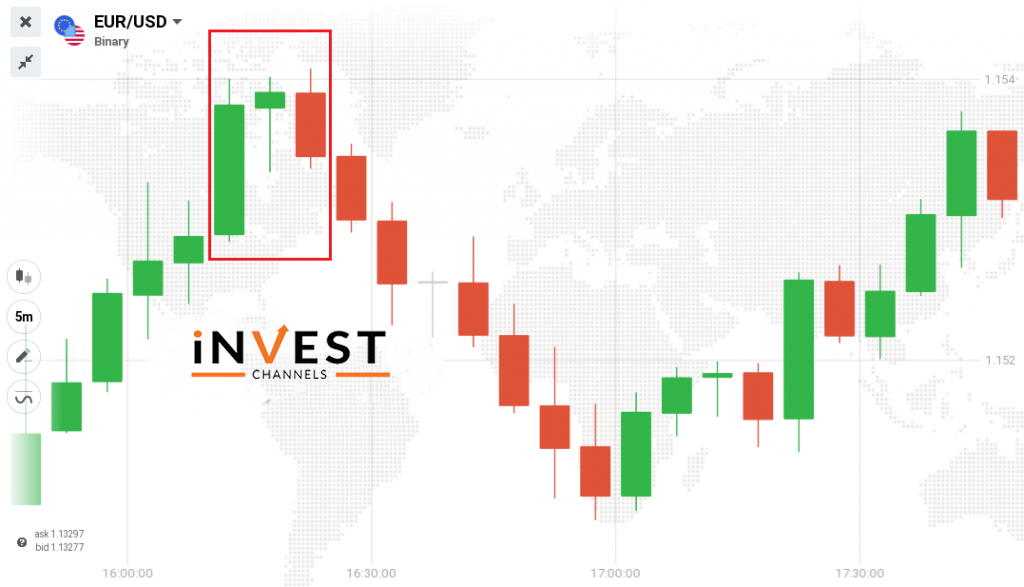
If you spot an Evening Star candle pattern, you know that the uptrend has ended and the only way to trade is by placing a sell order. But where exactly do you enter your trade?
You’ll need to wait until the first bearish candle forms completely. Your trade entry should therefore be at the closing price of this bearish candle.
Now, for how long should you hold the position? This largely depends on the candle interval. For example, if you’re using 5 minute candles, you can hold the position for 10 to 15 minutes. This makes it easier to shield yourself from small price fluctuations that occur during shorter time frames.
The Evening Star candle pattern is one of the easiest ways to identify a trend reversal from bullish to bearish. Any time you see this pattern, never try to enter a buy position.
Now that you know what the Evening Star candle pattern looks like, head over to your IQ Option practice account. Patiently wait for it to develop on a Japanese candles chart and trade it as you’ve learned.
Good luck!
You might also want to read


Top 5 Trending
"Why do I keep losing money in trading?" This is a question every trader has asked at some point. Experiencing… [Read More]
Trading indices is more than just a financial pursuit; it's both an art and science, demanding attention to detail, a… [Read More]
Forget Tiffany’s—there’s a diamond that traders treasure even more. Diamond chart patterns may not sit on a ring, but they… [Read More]
The Psychological Line (PSY) Indicator is a versatile, oscillator-type trading tool that compares the number of periods with positive price… [Read More]
Have you ever felt like your trading approach could benefit from a little extra energy? That’s where the Relative Vigor… [Read More]