
The Commodity Channel Index (CCI) is a popular oscillating indicator that can be used in all markets (not just commodities). It’s used to measure the asset’s current price against an average price over a period of time. It’s a flexible type of indicator that can be used to determine whether the asset is overbought or oversold. For traders who prefer long trades, this helps them determine when a trend is likely to reverse. It can also be used to predict divergence.
Setting up CCI on the IQ Option platform
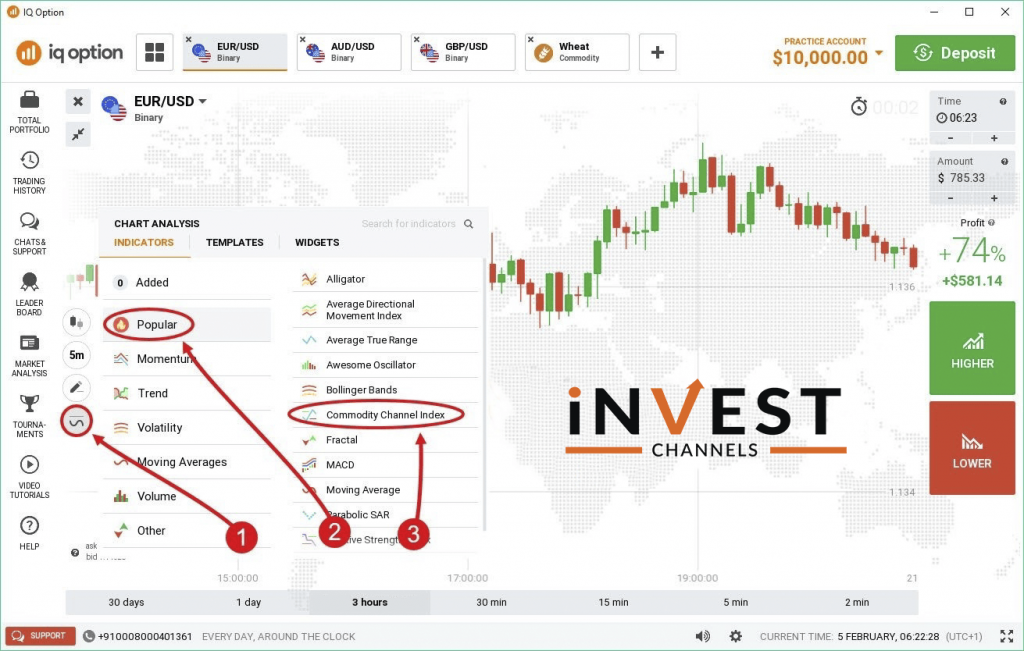
After logging in to your IQ Option account, go to the indicators feature.
Click on “popular” and then select the Commodity Channel Index. The indicator will appear at the bottom of your chart. It appears as a blue line that oscillates between -100 and +100.
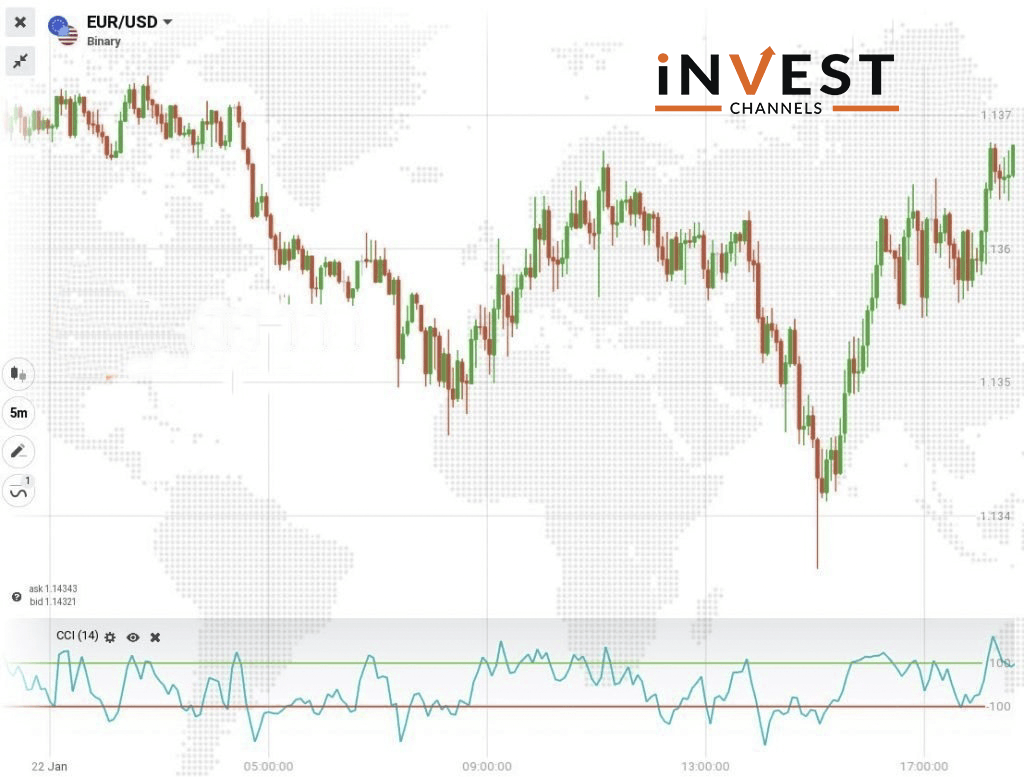
The CCI was created such that the blue line moves between two extremes. However, it can move beyond these extremes. So if the blue line crosses the +100, the markets are overbought. You should expect the prices to start falling in the future. Similarly, if the line crosses the -100, the markets are oversold and prices will start rising in the future.
How to trade using CCI on IQ Option
The first way to trade using CCI is by using the overbought and oversold signals. If the line crosses the +100, the markets are overbought. It’s a signal to prepare to enter a sell position when the line crosses the same line in a downtrend. When the blue line crosses the -100, prepare to enter into buy position when the line crosses the line in an uptrend.
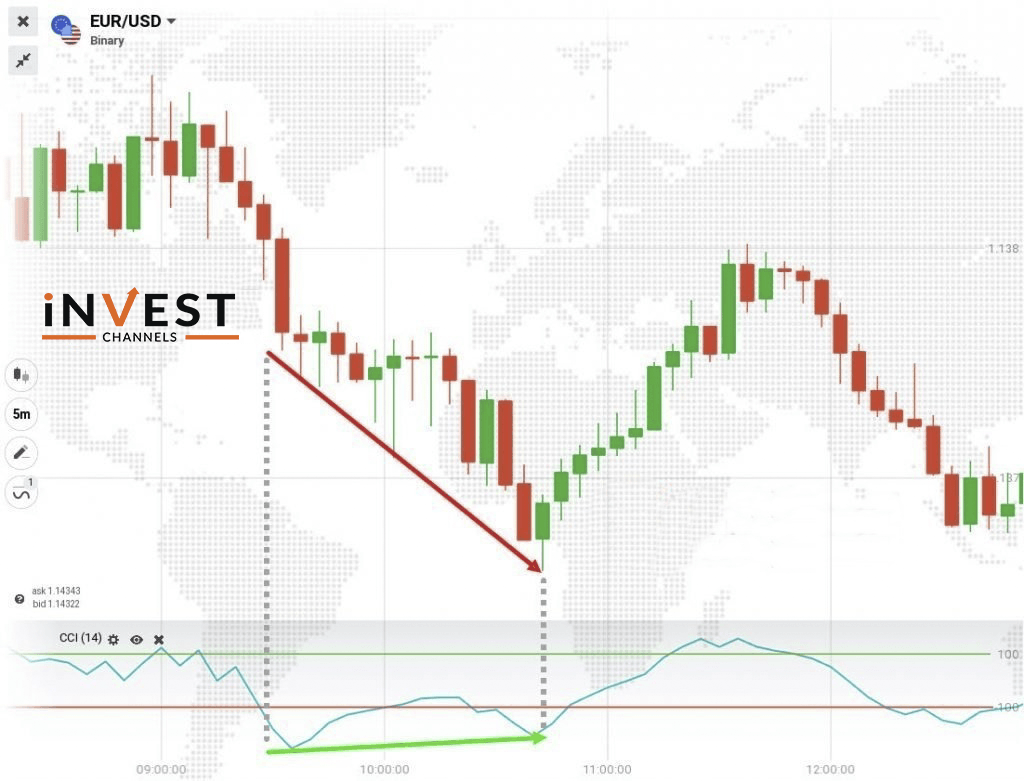
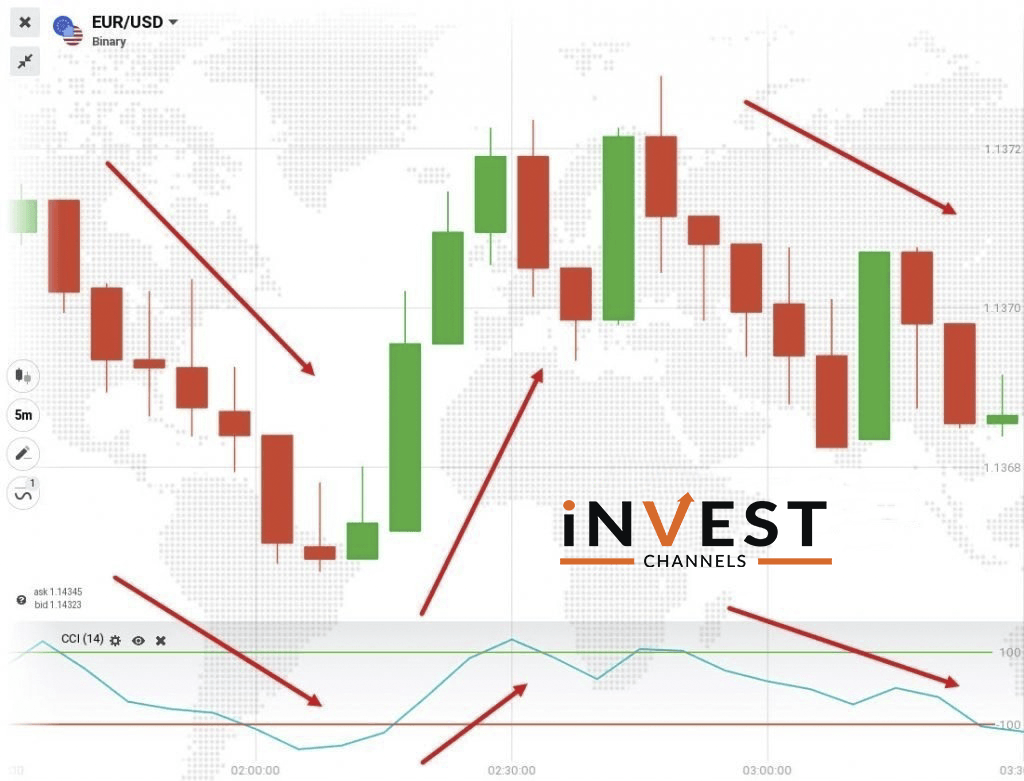
The second way to use CCI is to determine divergence. In this case, the prices on the chart are clearly falling. But the CCI is moving in the opposite direction. This divergence is a signal of an impending trend moving in the opposite direction.
Using the chart above, the prices are falling. However, the CCI is seen rising towards the -100, crossing it before falling again. As it crosses the -100, you’d expect an uptrend. But the CCI falls below the -100 before finally adopting a strong uptrend. The best time to enter a long buy position is when the CCI crosses the -100 the first time heading upwards.
The CCI indicator is a versatile technical analysis tool. But to get a feel of its power, you must practice trading with it. Start by opening an IQ Option practice account here and start trading with this cool oscillator.
Good luck!
You might also want to read


Top 5 Trending
"Why do I keep losing money in trading?" This is a question every trader has asked at some point. Experiencing… [Read More]
Trading indices is more than just a financial pursuit; it's both an art and science, demanding attention to detail, a… [Read More]

Forget Tiffany’s—there’s a diamond that traders treasure even more. Diamond chart patterns may not sit on a ring, but they… [Read More]
The Psychological Line (PSY) Indicator is a versatile, oscillator-type trading tool that compares the number of periods with positive price… [Read More]

Have you ever felt like your trading approach could benefit from a little extra energy? That’s where the Relative Vigor… [Read More]