The Exponential Moving Average (EMA) is a moving average indicator. Moving Average indicators are trend-following indicators which smooth out price data creating a line that follows the trend.
Many traders opt for the EMA over the Simple Moving Average. The reason for this is that EMA reduces lag by placing more weight on the most recent prices. For example, when using a 30 period EMA the weight is placed on prices over more than 30 days.
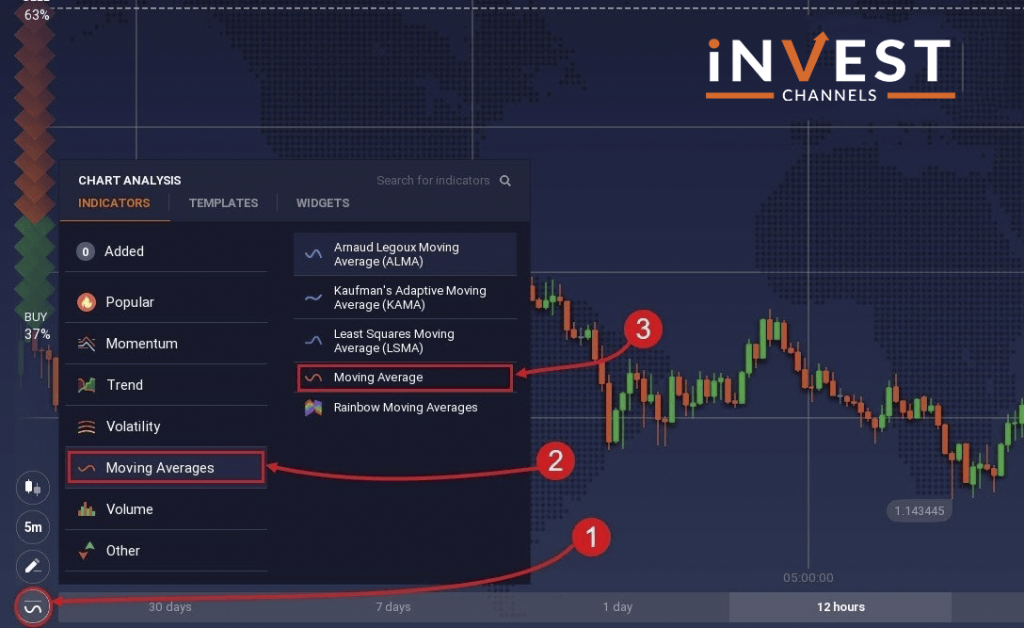
Setting up the EMA indicator on IQ Option
After logging into your IQ Option account, set up your Japanese candles chart.
Next, click on the indicators feature and then select moving averages. Next, select the Moving Average.
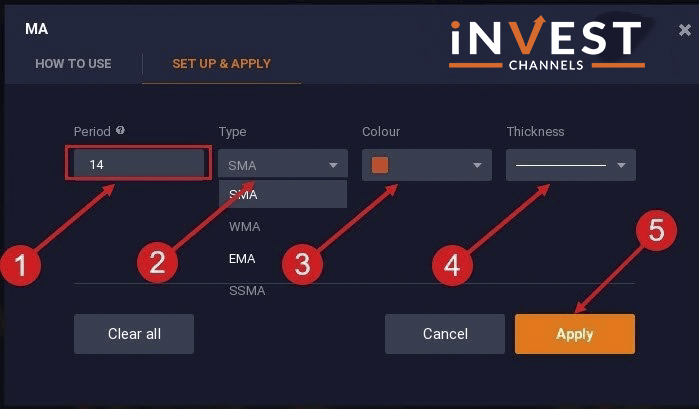
On the moving averages window, select a period greater than 10 (for a more accurate EMA). Next, change the type to EMA. On IQ Option, the default colour for the EMA is orange. Finally, click on Apply to save the settings.
In our first example, we’ll trade using the 14 periods EMA and 28 period EMA. You’ll need to repeat the setup procedure twice to create the two EMA lines. For EMA 28 change the colour to yellow. For the EMA14 change the colour to green. Remember to click on apply when you’re done.
Trading IQ Option using EMA14 and EMA28
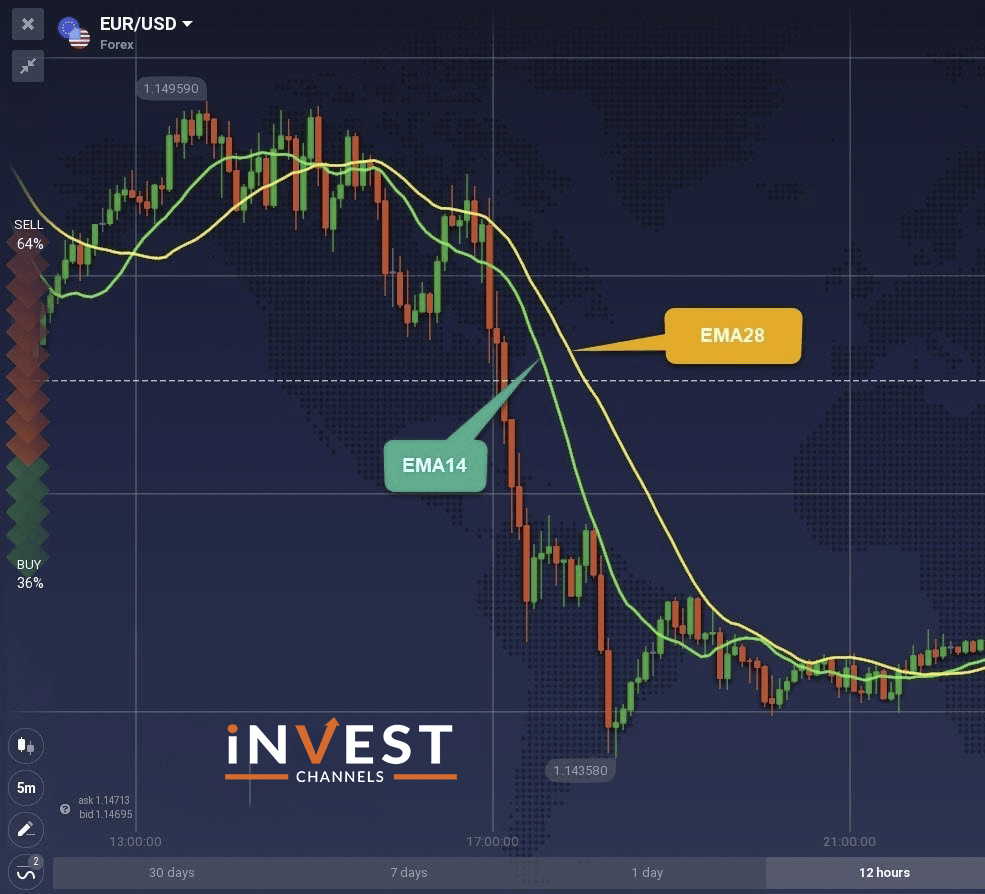
When trading using the EMA14 and EMA28, your objective is to identify where the two indicators cross each other as well as the distance between them as they track the prices.
When the EMA28 crosses under the EMA14 and the distance between them are wide, it’s a signal for a strong uptrend. The prices are above both indicators. You should enter a buy position. As the gap narrows, the uptrend is almost exhausted.
When the EMA28 crosses over the EMA14 and the gap between them widens, it’s an indicator of a strong downtrend. Here, the prices are below both indicators. You should enter a sell position.
When both indicators run through the prices, the markets are ranging. At this point, it’s best to sit on the sidelines and wait for a trend to develop.
Trading IQ Option using the EMA30
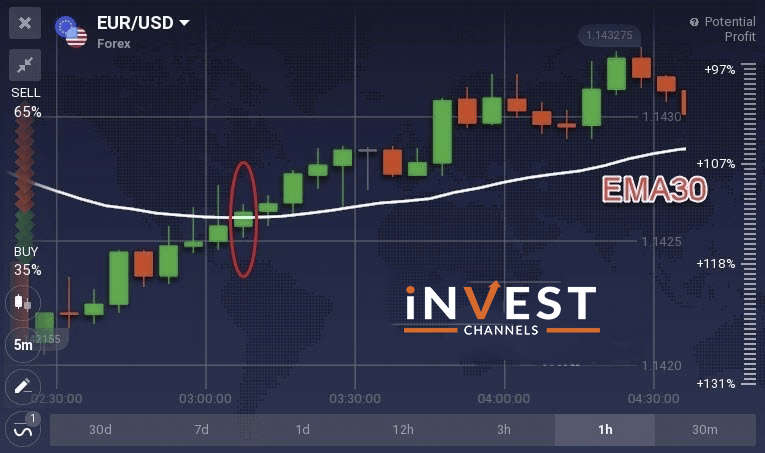
Another commonly used EMA is the 30 period EMA. It’s usually used to identify a developing trend. In the chart above, you’ll notice a developing uptrend.
But you don’t know exactly where to enter a buy position. The EMA30 can be used for this. Right where the EMA30 cuts the price (bullish candle) from above and runs below the prices, this is your entry point.
Now let’s take a look at a trend reversal to bearish.
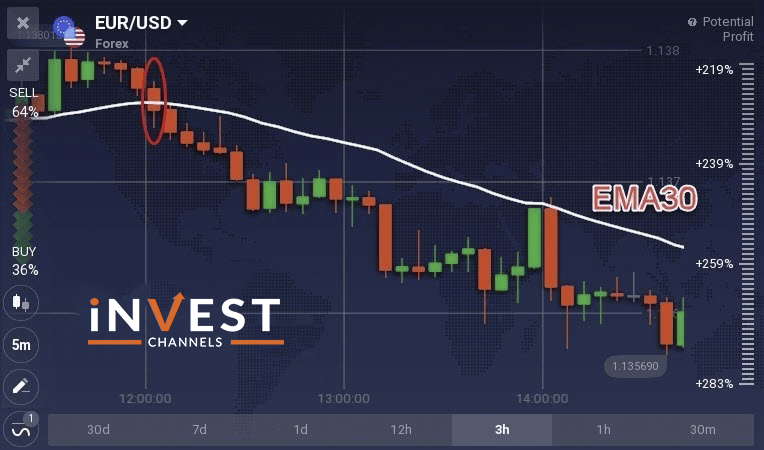
In a bullish trend, the EMA30 indicator runs below the price. In the image above, you can see the indicator cut across a bearish candle and starts moving above the prices. This is a good place to enter a sell position.
The EMA indicator is one of the simplest ways to identify a developing trend and trend reversals. Simply looking at the position of the EMA line relative to the prices will tell you whether the trend is up or down. In addition, once the EMA cuts through the price, it’s a signal that the trend is reversing.
Remember I mentioned EMA with periods greater than 10 provide better accuracy? This makes EMA indicators best for trading longer time frames.
Now that you know how to set up and trade with the EMA indicator on IQ Option, try it out on your practice account.
Good Luck!
Top 5 Trending
"Why do I keep losing money in trading?" This is a question every trader has asked at some point. Experiencing… [Read More]
Trading indices is more than just a financial pursuit; it's both an art and science, demanding attention to detail, a… [Read More]
Forget Tiffany’s—there’s a diamond that traders treasure even more. Diamond chart patterns may not sit on a ring, but they… [Read More]
The Psychological Line (PSY) Indicator is a versatile, oscillator-type trading tool that compares the number of periods with positive price… [Read More]
Have you ever felt like your trading approach could benefit from a little extra energy? That’s where the Relative Vigor… [Read More]

