
Finding the right entry point along the trend is a common problem for many traders. Many traders often question “What is the best time to trade after identifying the trend?” This guide will show you the best time to enter the market and make money trading only by 2 indicators.
In this guide, you will find the time-tested TLS (T = Trend, L = Levels, S= Signals) which is used by many successful traders for decades.
This strategy I learned through a reader who emailed this strategy that turned $100 to $249. After trying this strategy, the results were profitable.
Here I’ll use the TLS method to show you how to turn $100 to $249. As usual, I will use the IQ Option real account.
Now let’s get started!
Overview of Trend Level Signal
There are three conditions. This strategy works when each condition are met
The first condition is, there must be a clear trend.
The second condition is that the level should be easily identifiable. In this case, it is a support or resistance.
And finally, there must be a clear trading signal. This could be any candle that signals the start of a trend after price consolidation.
Trading using TLS on the EUR/USD pair
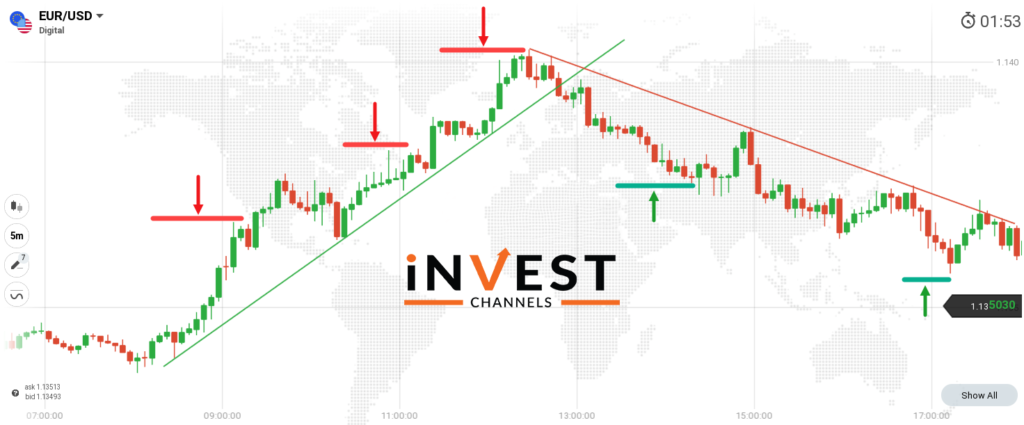
If you can see the chart below, you can see that there is a clear uptrend. This exhaustion and reverse created a downtrend. There are two trend lines to make the trends easier to see.
I’m using the EUR/USD 5 minute time interval chart.
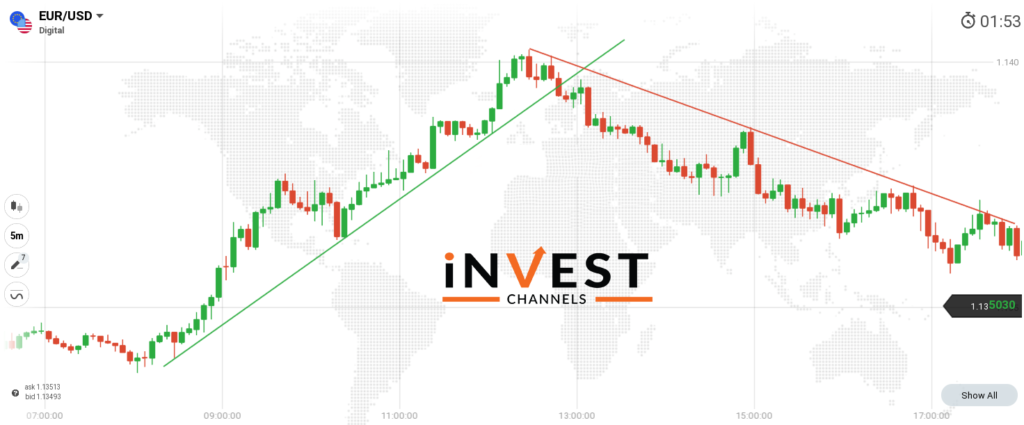
Clear trends offer many entry points that are the reason why these are necessary for the TLS strategy to work. For example, In the case of an uptrend, bull positions can be entered anywhere along with the trend.
How to identify trade entry points
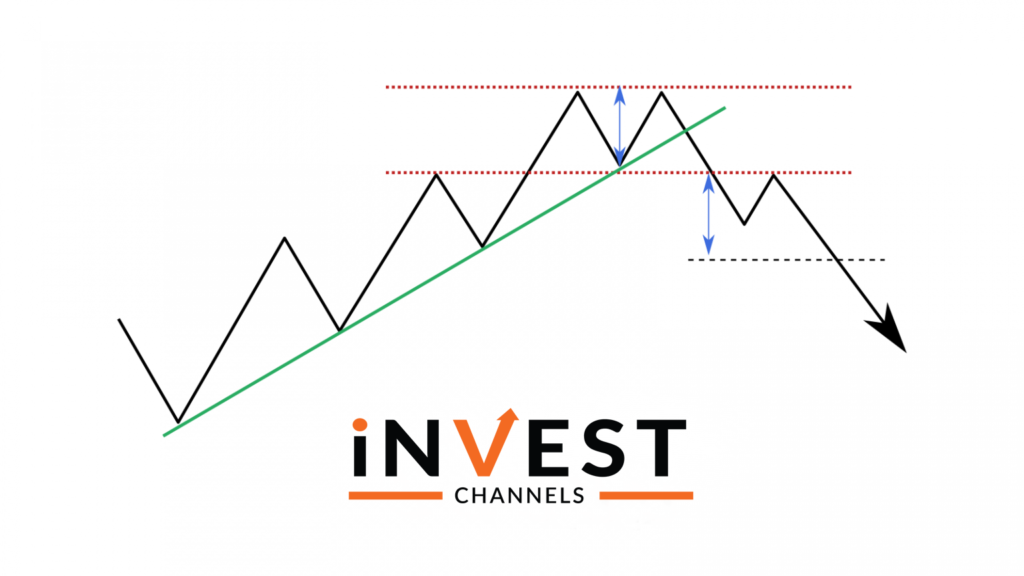
The main objective is to identify the right trade entry point along with the trend when using the TLS strategy. Begin with drawing your trend lines. For an uptrend, the line should touch at least 2 high-lows and for a downtrend, the trend line should touch at least 2 low-highs.
After finishing up with the lines, now it’s time to identify support and resistance levels. These are the points where price consolidation occurs before the prices adopt a trend.
Take a look at the image below.
Using the EUR/USD chart, there is also an RSI indicator. Why? well, RSI is a good way to identify possible trend reversal points. Just have look at the image shown below. A downtrend starts to develop, once RSI crosses the overbought line from above.
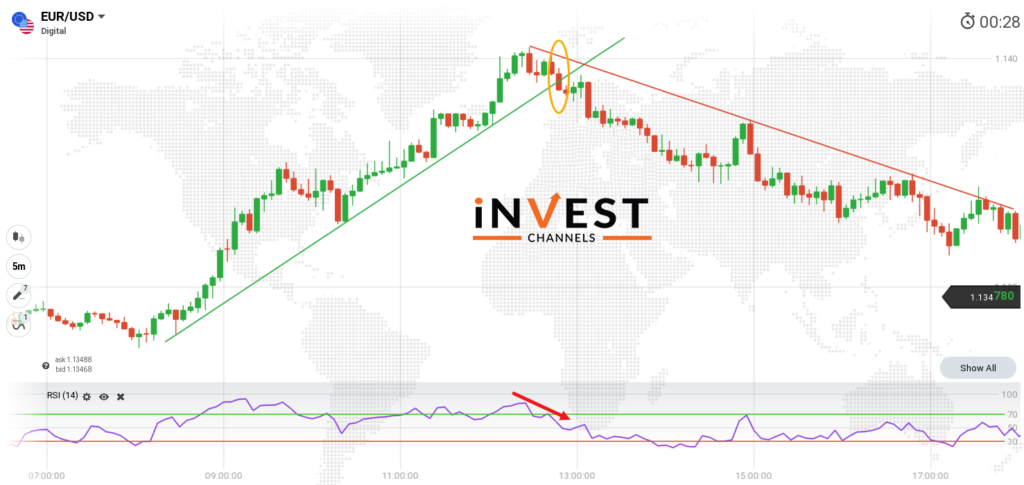
Why did I include the RSI indicator?
RSI is a very good tool to identify potential trend reversal points besides that it is very easy to avoid false breaks. It means that as prices move with the trend, there will be points of consolidation. The prices appear to reverse temporarily before proceeding along with the trend.
Let us take an example, check the uptrend in the above chart. Along with the resistance levels, a false break will appear. Here, you’ll notice one or more bearish candles forming. Here, the trend isn’t fully exhausted which means entering a sell position would end up in a losing trade.
You can read the guide to Trading Using the Trendline on IQ Option to know more about trading using the trend line.
The Guide to Trading Using RSI and Support/Resistance on IQ Option should also get you started on using these two indicators.
Identifying possible trade entry points
Once you are done with a chart and draw the trend line as well as set up the RSI 14 indicator, the next step will be identifying the possible trade entry points.
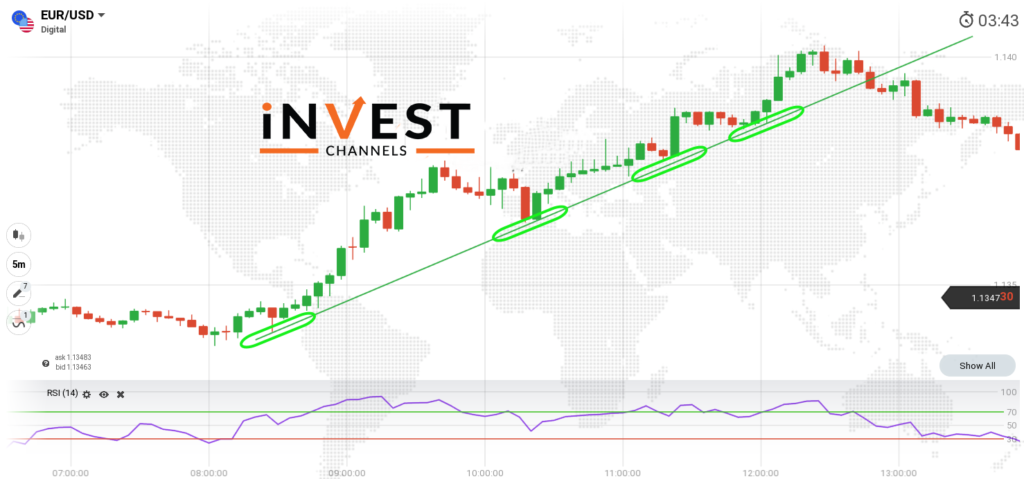
Using the trend line there are four possible trade entry points. three signals, first, third and fourth were signalled by a bullish pin bar. the overbought line crosses the RSI line from below indicating trend continuation and the second possible entry point was signalled by a large bullish candle.
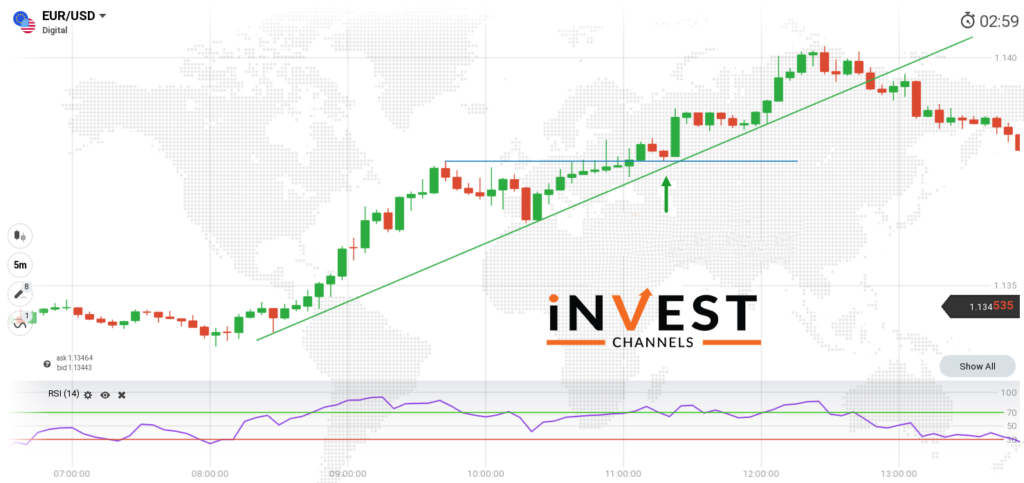
Using support and resistance to identify possible trade entry points
You can have an idea by using RSI along with the trend about where to enter trades when the trend is strong. But when the trend reaches exhaustion, you will not know when it is bound to reverse. That is where support and resistance levels come in.
Look at the above chart. Here you can see the resistance line that shows that once prices touch it, they will typically fall. But the uptrend continues in this case.
You will notice that once the prices hit the resistance and break it, one bearish pin bar develops. which is then followed by a bullish pin bar. These signals offer a good place to enter a buy position.
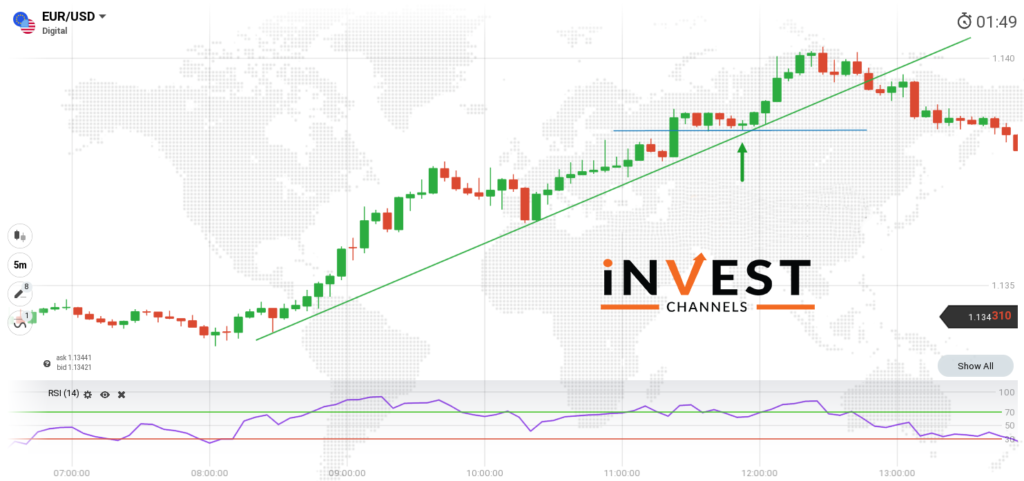
You can see the chart above, you will notice that there is a support line once it intersects the trend line, a bullish bar will develop. it shows that a bullish bar will develop which implies that the uptrend is likely to continue.
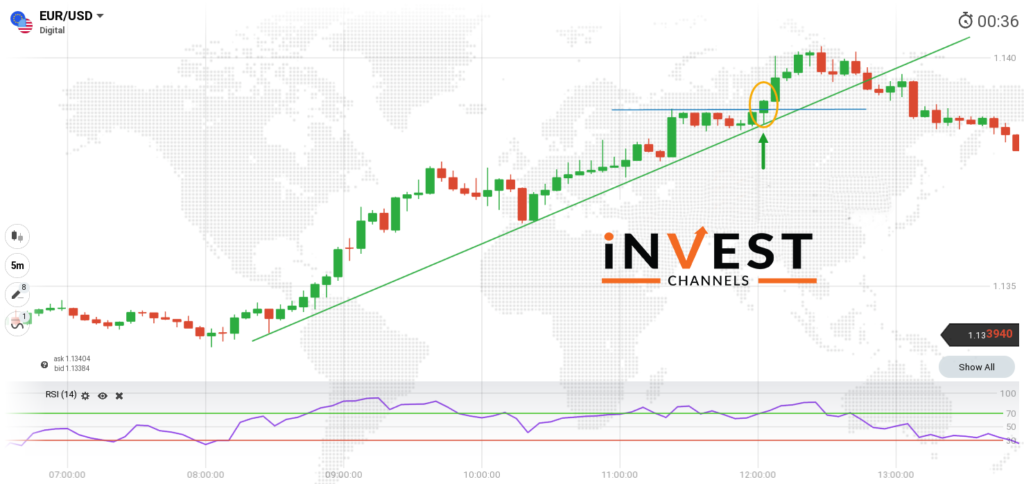
Trading trend reversals
Now here the uptrend finally gets exhausted. However, the reversal didn’t occur immediately and is only after drawing the support line that makes it easy to identify a possible entry point. You will notice a small retracement once the prices broke the support. The downtrend starts when the bearish pin bar develops supported by a solid bearish candle. This point can be considered as a good point to enter a sell position.
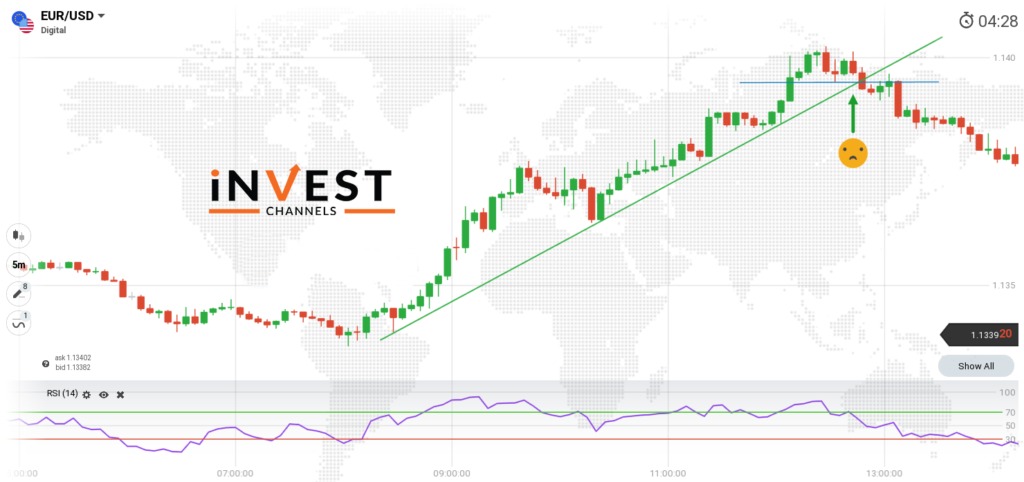
Turning $100 into $249 on IQ Option
Re-investing profits is one of the reasons why successful traders consistently make money. Like, if their first trade is successful, they invest their profit and return their initial investment to their account.
The table below explains it better.

The table above turns $100 into $249 using four trades only. Here, you’ll use the profits from successful trades as your investment for the next trades.
So, the profit from the second trade will be invested in the third trade. If you encounter a losing trade, you can opt to stop or start the process again. Using this table, you can see that 4 successful trades will make you 2.5 times your initial investment.
If you’re like most traders, you might think that losing $100 in your first trade is highly likely. Rightly so. But if you use the TLS method I’ve discussed above, you’ll stand a better chance of profiting.
If you identify a trend, use the trend line to confirm it. Then draw support and resistance lines to determine the best entry points. Use the RSI to identify potential trend reversal points. This increases your chances of making successful trades.
Note that this money management strategy is simply a suggestion. There are other ways to make it work for you. For example, you might want to invest a fraction of your profits on subsequent trades to secure most of your profits. It all depends on your risk tolerance and money management approach.
Trading downtrends using TLS and support/resistance on IQ Option
First entry point: Prices return towards previous resistance indicating a reversal
You can see the chart below on the basis of that you can see the support line for an uptrend. Once the trend reverses, this becomes the resistance for downtrend development. At this point, you will notice that the false break occurs developing two Doji candles. Once Doji is fully developed you can determine which direction the price will take. A large bearish candle confirms the downtrend. At this point, you enter a sell position.
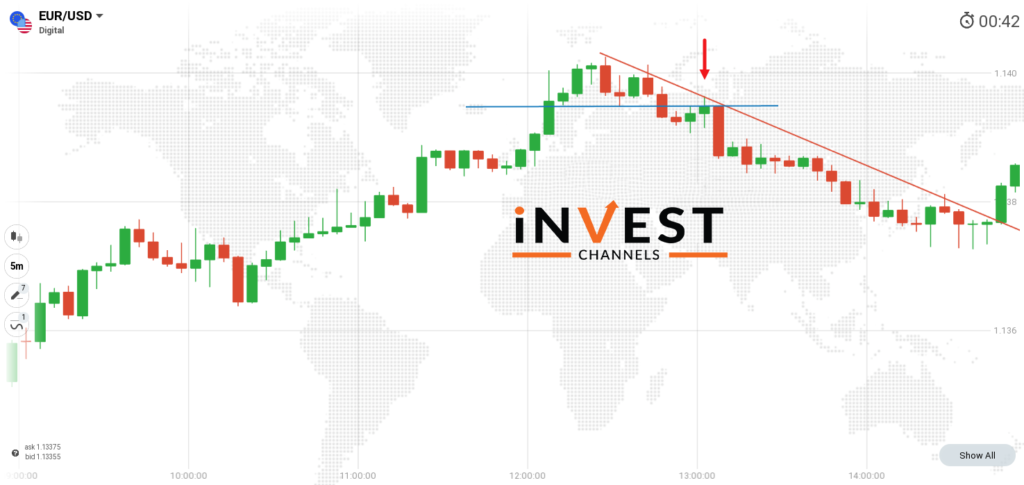
You can also use the trend line besides using the bearish candle as your trade entry signal.
Second entry point: The markets are ranging before breaking through the resistance on a downtrend
By the same chart, you can draw another support resistance line that connects the lows of the uptrend and downtrends. When this line intersects with the trend line it provides a possible breakout point. This can later be confirmed by a bearish candle.
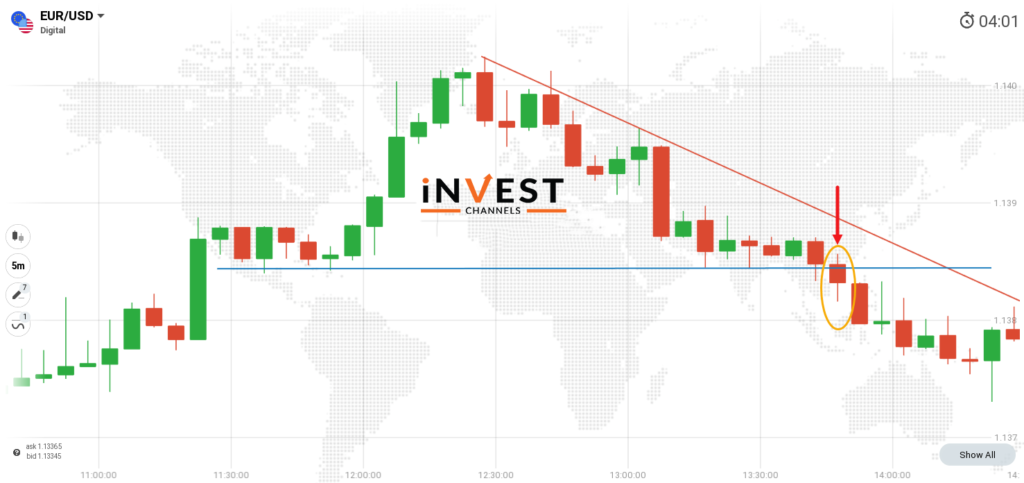
You should note that you should enter a short sell position at this point
Why?
The downtrend is in the early stages. The support line is connected to lows from candles in the uptrend and downtrend. Here prices might reverse as can be seen in the below chart.
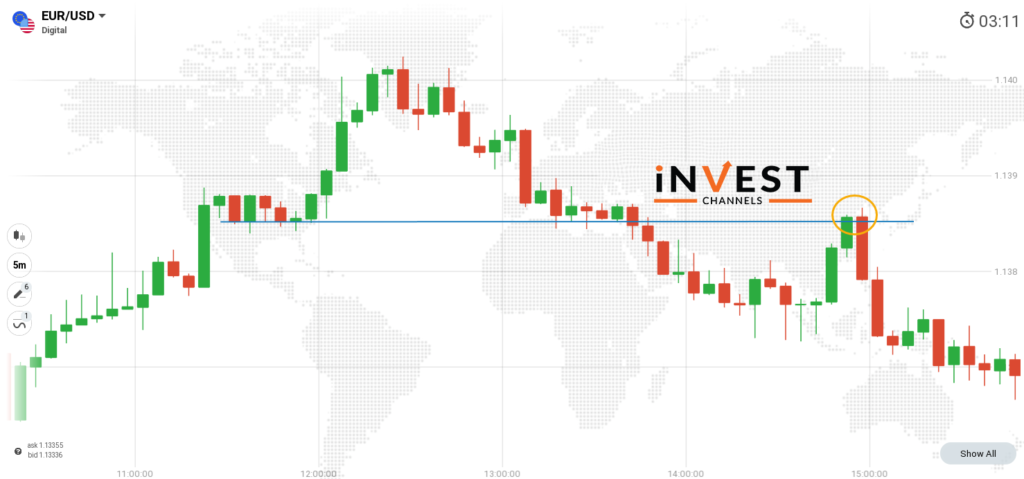
Entry point 3: Price rises to previous resistance then continue to drop
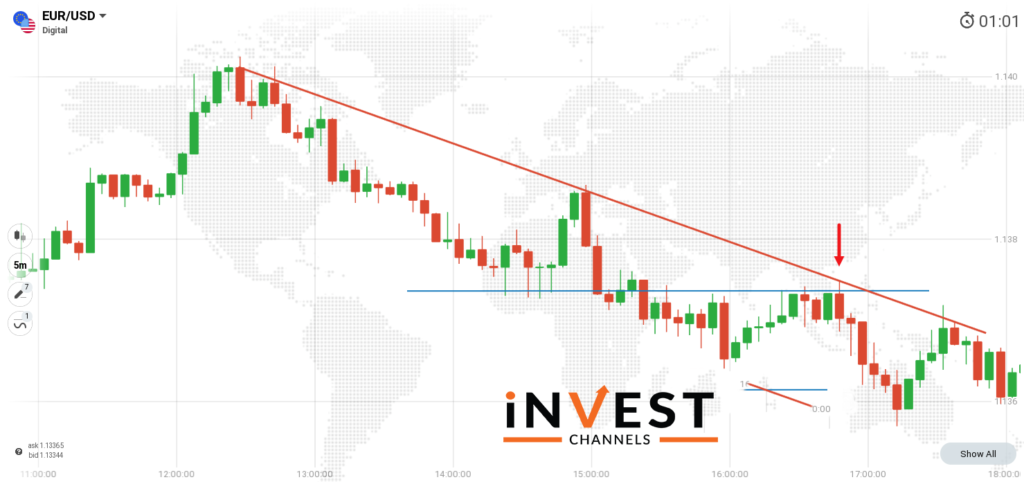
if you want to know the good entry point, the resistance is drawn connecting the candles along with the downtrend. In the below chart there is a resistance line and the prices tend to rise to this point before falling again. At this point also, both the trend line and resistance intersect and a large bearish candle forms seller is taking over the markets.
Working with the trend is key to success
It is often said that “the trend is your friend” which is very true. Trends have existed since the markets were discovered and can easily recognize by simply looking at the chart.
Another great thing is that they will ultimately reverse giving you the chance to profit whatever market conditions prevail. The reversal occurs after the pauses. It helps you to identify entry points.

Managing emotions while trading using TLS on the IQ Option platform
There should be an uptrend to continue until the market decides to range or reverse. Also, there should be a downtrend to continue until it reverses. You will end up losing money if you try to predict the maximum price point or the lowest point an uptrend or a downtrend will get respectively.
Never try to trade against the trend in the market. The result will only loss of money. Also, never try to recover your losses by trading a larger amount. Stick to your principles to protect your trading account.
The main reason for traders losing money on IQ Option is letting emotions get the better of them. So, it always returns to having a sound plan before entering into any position. Stick to your strategy and if it doesn’t seem to work, stop trading with real money and test the strategy in your practice account.
One of the main reasons many traders lose money on IQ Option is to let their emotions get the better of them. So it always pays to have a sound plan before entering into any position. Stick to your plan and if it doesn’t seem to work, stop trading with real money and test the strategy in your practice account.

Now, you have read a lot and learned about the trend level signals. The main focus is to identify trends, support and resistance levels and identify the right time to enter a trade.
You’ve also learned some basic money and emotional management strategies that can help you protect your account and make some money trading.
Let me know your views in the comments section below.
Good luck!
Top 5 Trending
In the world of online trading — often filled with risk and uncertainty — verifying the credibility of a platform… [Read More]
Starting your trading journey can feel overwhelming — there are countless assets to choose from, and it’s hard to know… [Read More]
"Why do I keep losing money in trading?" This is a question every trader has asked at some point. Experiencing… [Read More]
Trading indices is more than just a financial pursuit; it's both an art and science, demanding attention to detail, a… [Read More]
Forget Tiffany’s—there’s a diamond that traders treasure even more. Diamond chart patterns may not sit on a ring, but they… [Read More]


