Heikin Ashi is a hybrid candlestick chart combination of the traditional Japanese candlesticks chart among the different charts offered on the IQ Option platform. In this guide, you will learn about the chart type and how to trade using it on the IQ Option platform.
Overview of the Heikin Ashi candles
These Heikin Ashi candles are similar to Japanese candles which have bodies and wicks. The difference between Heikin Ashi candles and Japanese candles is how they’re created.
These candles use the open, close, high, and low of the current period as well as open and close prices from the previous period. Each candle’s formula is calculated as follows:
- Close = Open of current period + High of current period + Close of current period + Close of current period / 4
- Open = Open of previous period + Close of previous period / 2
- High is the highest value among the high of current period or, the open of the current period or, the close of the current period
- The low is the lowest value among the low of the current period or, the open of the current period or, the close of the current period
These candles are great for the technical analysis tool and are used to identify trends and are especially good for placing long positions. Also, we can identify potential reversal points on the price chart.
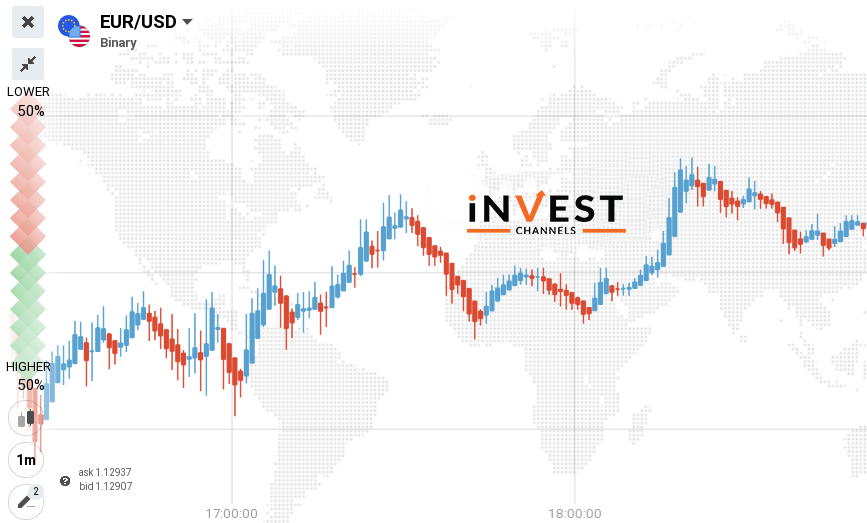
You can see a consecutive pattern of multiple bullish or bearish candles in the above chart which makes a good reason for Heikin Ashi candles for entering trades that last 5 minutes or more.
Setting up Heikin Ashi candles on IQ Option
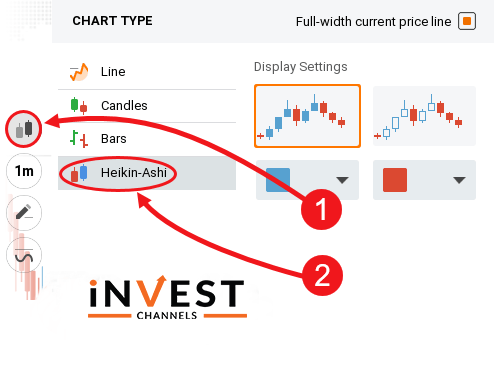
Click on the feature and select Heikin Ashi after logging into the IQ Option trading account.
Trading using Heikin Ashi candles on IQ Option
As we have discussed that for long positions Heikin Ashi candles are best. So, keep in mind that your trade should last at least 5-minutes if you are using 1-minute interval candles. Enter your trade when you find a clear trend development and if there is no trend there will be an alternation between blue and red candles.
Trading with Heikin Ashi candles without any indicators
You can use Heikin Ashi candles without any indicators and just observe the colors of candles
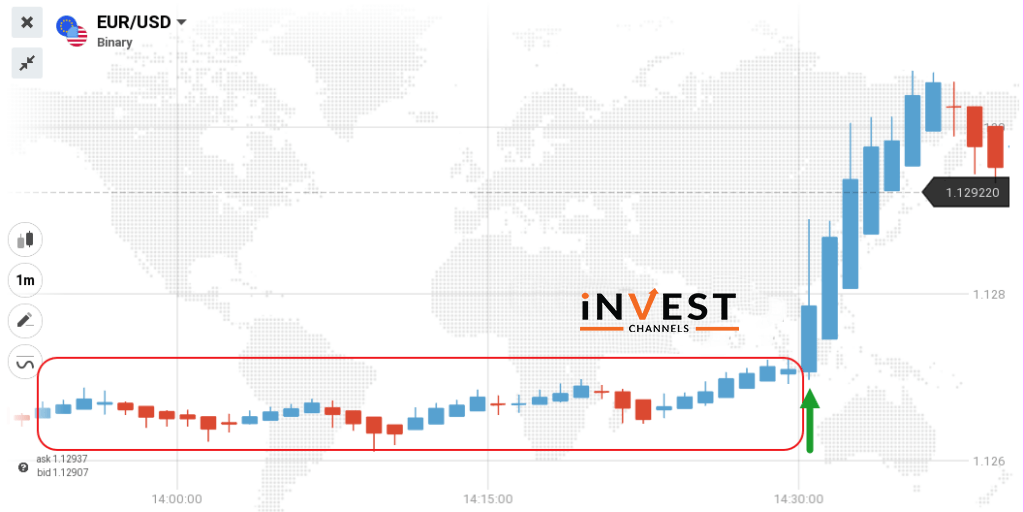
In the above chart, you can see the range in the market and the development of an uptrend which is indicated by a long bullish candle. This is your entry point. 1-minute interval candles are used in the above chart so, the trade should last at least 5 minutes.
If you prefer to hold a position for 15 minutes or more, you should use 5-minute interval candles.
Using Heikin Ashi candles alongside the Stochastic Oscillator indicator
Heikin Ashi candles can also be used alongside the indicators just like other candles. We will use the Stochastic Oscillator in the example as this indicator is used to predict possible trend reversal points in your price chart.
To learn more about it, the Guide for Using the Stochastic Oscillator to Trade Trend Reversals on IQ Option will get you started.
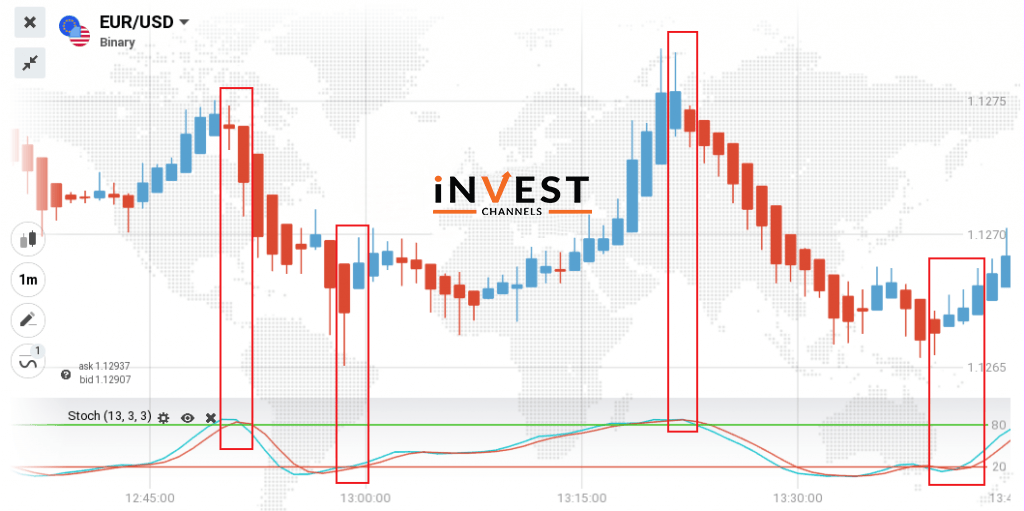
Your main objective will be to identify the points where the intersection of the %k (red) line and %d (blue) line occurs and moves above or below it. in the above chart. Also, look at the overbought or oversold lines, and if these lines cross each other then note that this is a good time to enter a long position.
You will notice the development of an uptrend when the %k line crosses the %d line and moves below it. When this development occurs, you can enter a buy position lasting at least 5 minutes. And in the opposite situation when %k crosses the %d and moves above it, a downtrend is developed and, in this case, you can enter a sell position lasting at least 5 minutes.
Now, it’s time to apply your Heikin Ashi knowledge to the IQ Options practice account.
Good luck!
Top 5 Trending
"Why do I keep losing money in trading?" This is a question every trader has asked at some point. Experiencing… [Read More]
Trading indices is more than just a financial pursuit; it's both an art and science, demanding attention to detail, a… [Read More]
Forget Tiffany’s—there’s a diamond that traders treasure even more. Diamond chart patterns may not sit on a ring, but they… [Read More]
The Psychological Line (PSY) Indicator is a versatile, oscillator-type trading tool that compares the number of periods with positive price… [Read More]
Have you ever felt like your trading approach could benefit from a little extra energy? That’s where the Relative Vigor… [Read More]


