The current trend, its strength and the probability of reversal can be determined by the MACD indicator. It consists of a signal line, the bar chart and the MACD line.
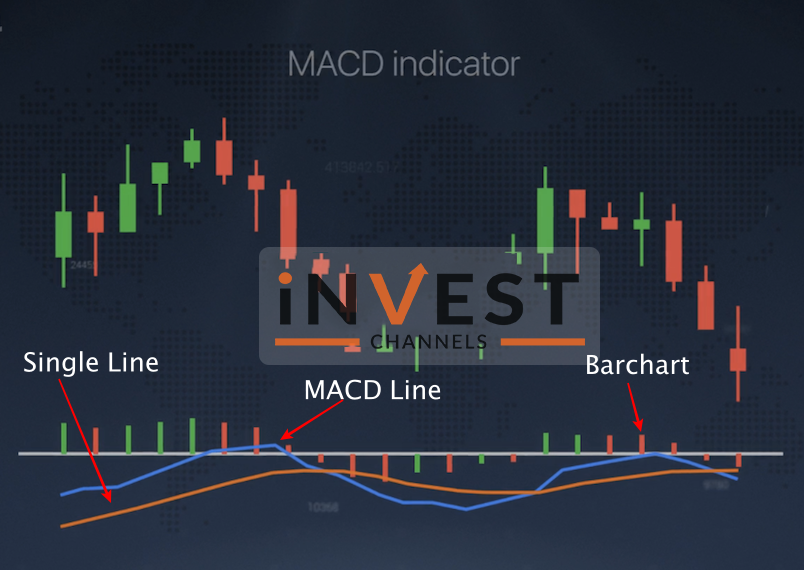
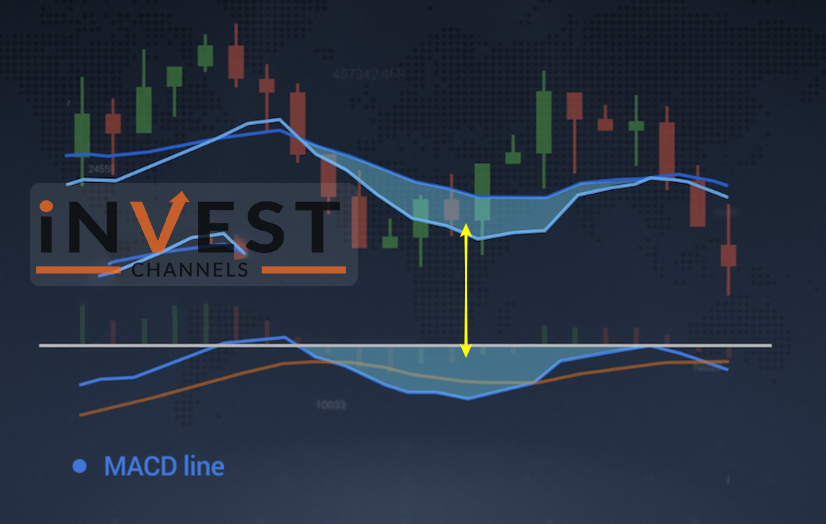
The MACD line
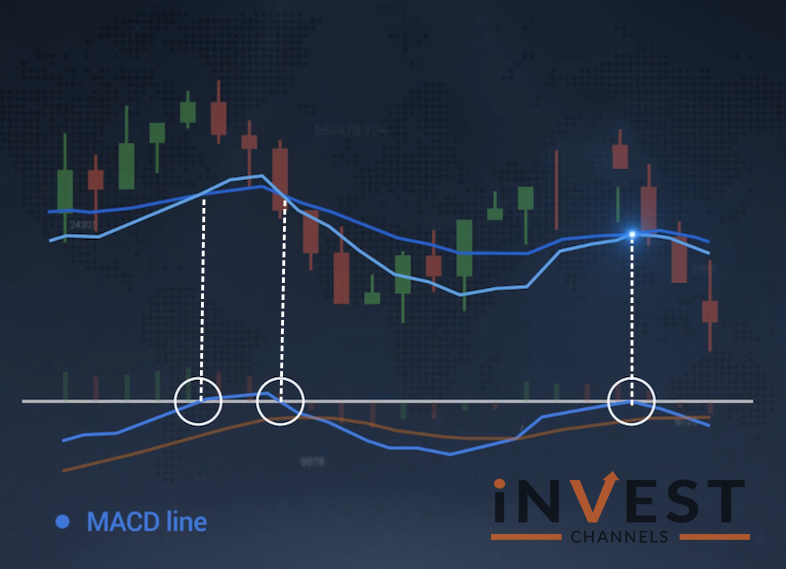
The MACD line is a trend-following momentum indicator that shows the difference between two EMA moving averages with different periods. When the MACD line cross zero on the line it indicates that there is no difference between them at the moment.
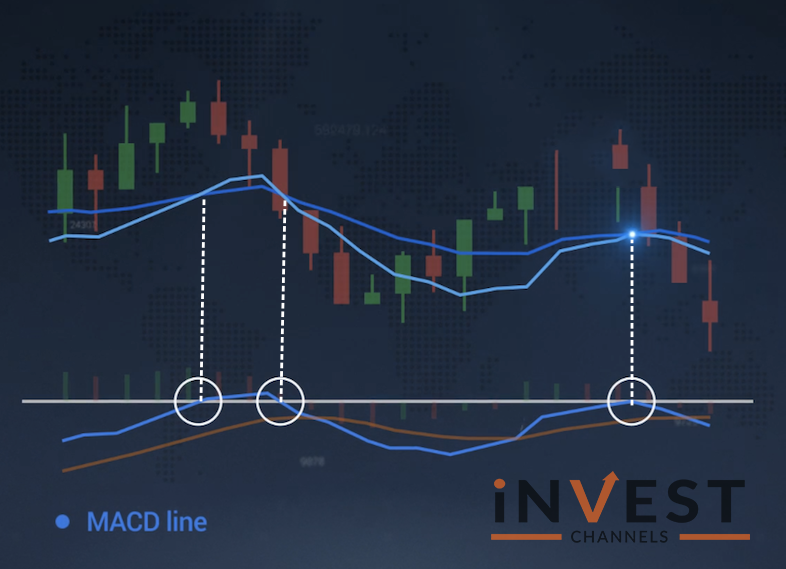
The larger the difference between two moving averages the further the MACD line is from the zero lines.
The signal line
A smooth MACD line is the signal line. And for calculation, the average value of the previous nine periods is used.
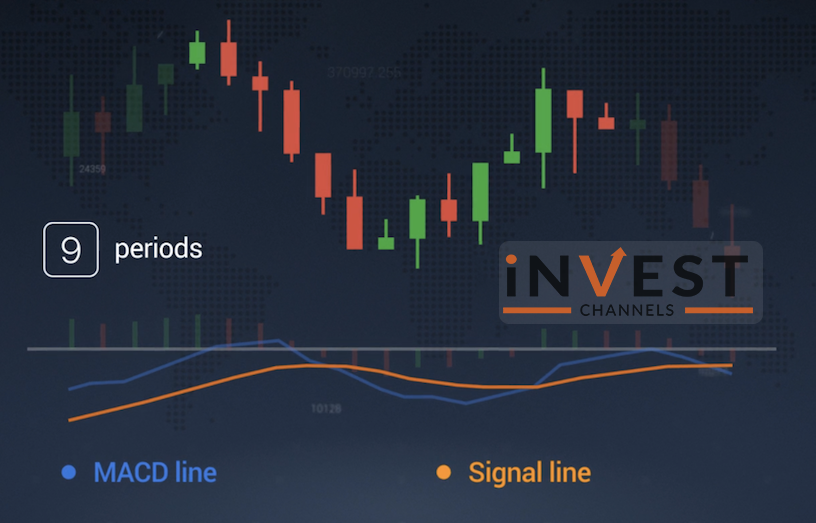
Fast MACD crosses the signal line which acts as a slow-moving average.
MACD bar chart
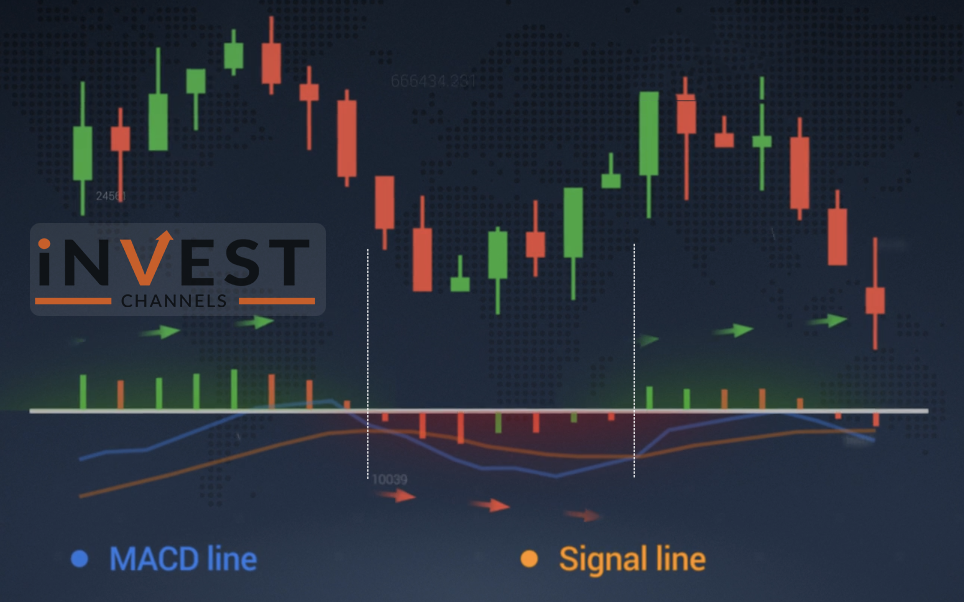
Distance between the signal line and the MACD line is displayed by the bar chart. Depending on the price movement direction, it changes its polarity relative to the zero lines. The bar chart will be above the baseline when the price goes upwards and the bar chart will be below when it goes downward.
MACD settings and basic interpretation
You can set the periods for MACD by changing indicator settings.
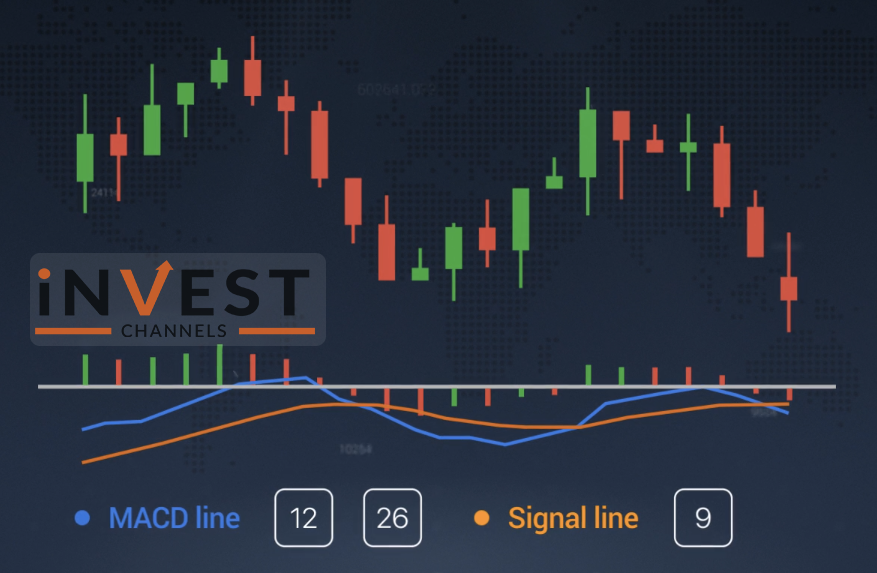
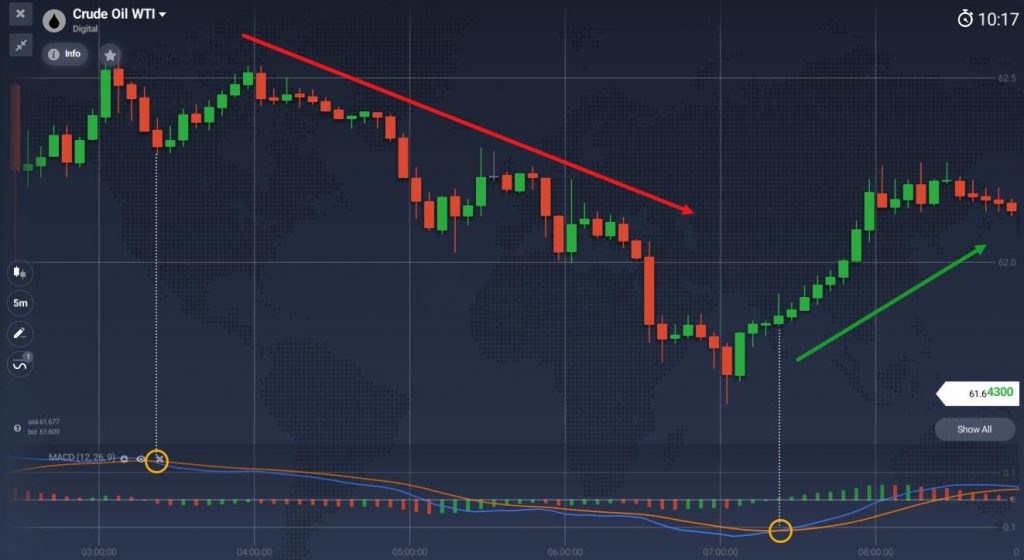
When there is an intersection in an upward direction between the signal line and the MACD line it shows the possibility of price enhancement. But when the intersection of the signal line and MACD line occurs in a downward direction, it implies a possible price reduction. The MACD indicator is very efficient and simple. We recommend you read more about combining MACD with PSAR.
We wish you a pleasant trading experience.
Top 5 Trending
"Why do I keep losing money in trading?" This is a question every trader has asked at some point. Experiencing… [Read More]
Trading indices is more than just a financial pursuit; it's both an art and science, demanding attention to detail, a… [Read More]
Forget Tiffany’s—there’s a diamond that traders treasure even more. Diamond chart patterns may not sit on a ring, but they… [Read More]
The Psychological Line (PSY) Indicator is a versatile, oscillator-type trading tool that compares the number of periods with positive price… [Read More]
Have you ever felt like your trading approach could benefit from a little extra energy? That’s where the Relative Vigor… [Read More]

