Identifying support/resistance levels is one of the most important skills a trader must develop. This skill allows you to understand how the price behaves when it approaches the support or resistance. As such, it becomes easier to know the best places to enter or exit an open position.
In some instances, the price will hit the support or resistance and then reverse. In other instances, it will break through the support or resistance levels. This guide shows you how to identify when the price wants to break the support or resistance. It also shows you what to do in such a scenario.
How do you know when the price is about to break through the support or resistance?
I assume you know what support and resistance levels are. However, just in case you don’t know these are price levels which prices seem to range within. That is, the prices don’t seem to go above or below these levels over an extended amount of time. This guide will detail the topic in depth: Support and Resistance, the two best technical indicators that IQ Option traders must know.
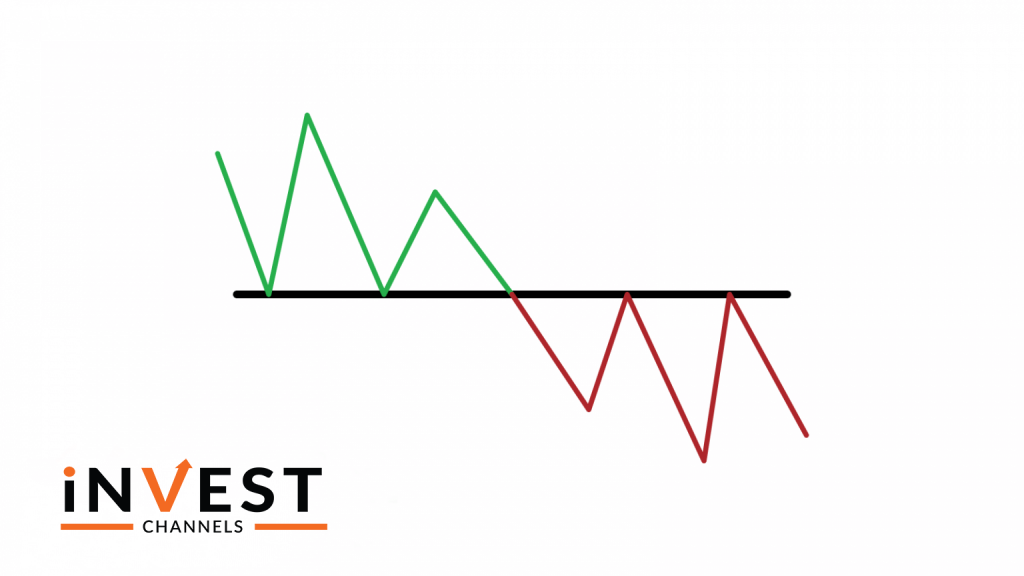
As the price of an asset fluctuates over time, it usually reaches a certain price level where it bounces back. This is the support or resistance. The support forms at the lower price point while resistance forms at the higher price point. Support and resistance levels are either weak or strong.
The strength of a support/resistance level is measured by the number of times the price has touched them before bouncing back. Strong support and resistance levels are those that the price has touched a number of times over a specific period. If the price touches a support or resistance level just once before breaking through, it’s considered weak. The Price momentum needs to be quite strong for it to break through a strong support/resistance level.
How to know if price momentum is strong enough to break through support/resistance
Using a candle chart, you should first identify the prevailing trend. If it’s a strong one, you’ll notice that the candles forming are larger often with two or more same-coloured candles forming consecutively.
You can also expect the price momentum to become strong if there’s a news or economic event on the way. Just after the news release, you will see that prices will move in a certain direction, often breaking through the support/resistance levels.
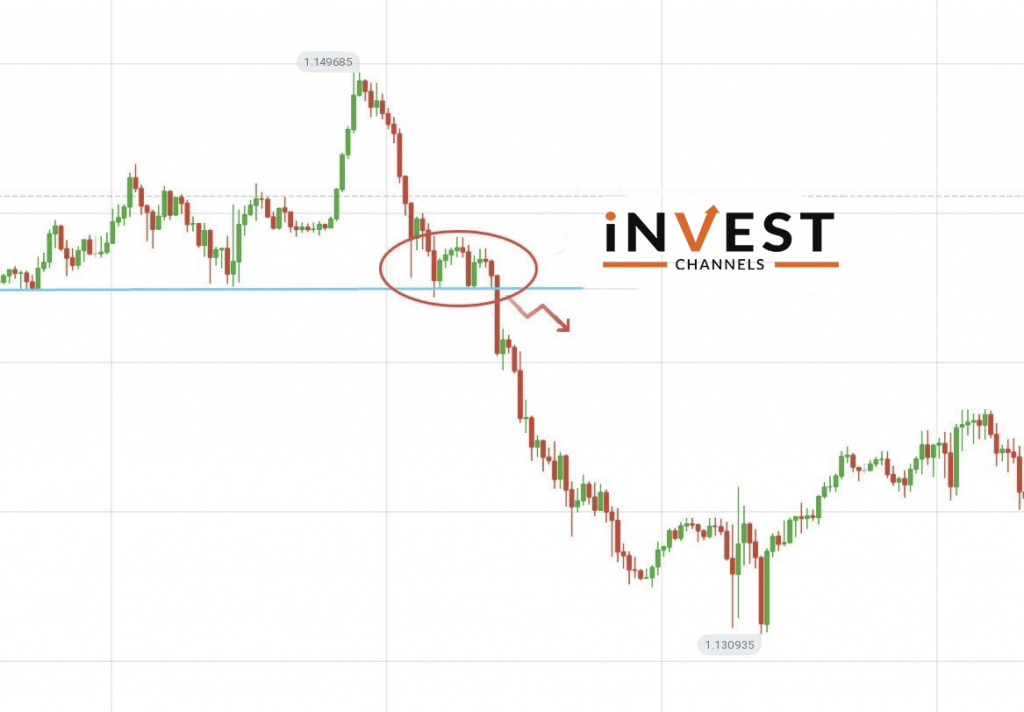
In other instances, there is a price consolidation right before it reaches the support or resistance. That is, the price falls within a narrow range. As the price approaches the support/resistance, it has gained enough momentum to break through. However, in most cases, the price usually falls back into the range before finally breaking through.
Here’s an example:
Avoiding false breakouts
False breakouts occur when the price breaks out of the support/resistance level and almost immediately falls back within the range before the trend reverses. False breakouts are where most traders incur losses.
One way to avoid false breakouts is to look at how the price behaves when it hits a strong support/resistance. That is, what trend develops?
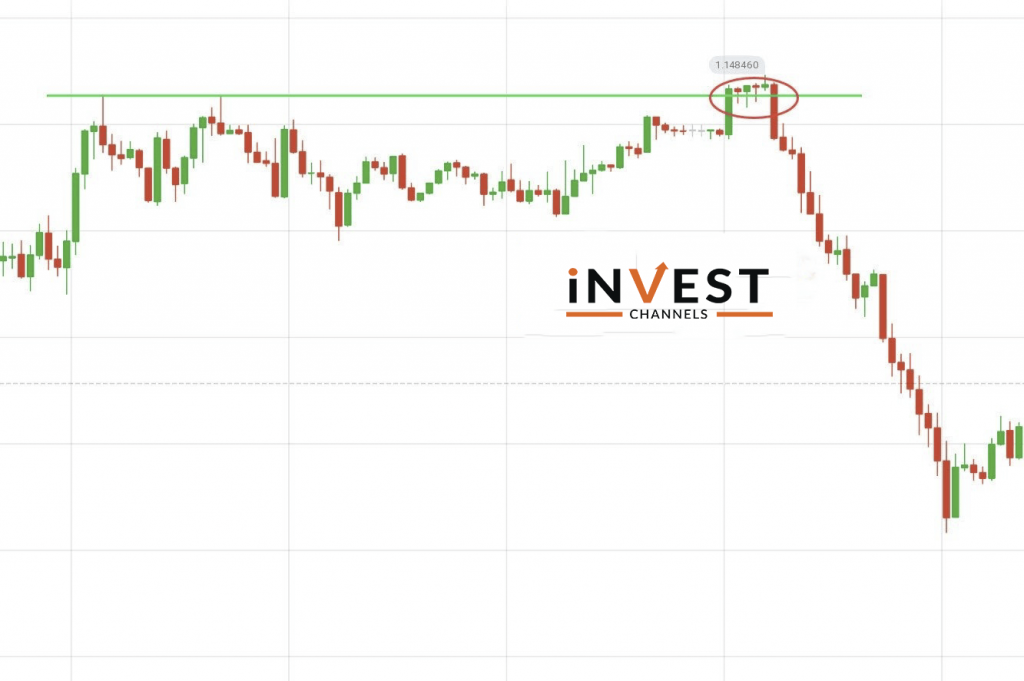
Using the snapshot below, you’ll notice that the prices will develop a downtrend when they hit the resistance. The false breakout occurs when the price breaks the resistance and remains above it.
Then, a solid bear candle breaks the support indicating a downtrend. This is where you should enter your trade.
What action should you take once the price breaks the support/resistance on IQ Option?
If the price breaks through a weak support/resistance you can expect the trend to continue in the same direction. In the case of strong support/resistance consider how the price behaves when it touches this level.
If you look at our snapshot above, the price usually develops a downtrend. If the breakout occurs, wait until the markets behave like they did when prices hit the support/resistance. That’s the time to enter the trade based on the developing trend.
Why do false breakouts occur? False breakouts usually occur when traders enter the market when it’s already overextended and ready for a reversal. In the example above, it’s probable many traders assumed that the trend was going to go up.
But professional traders know that waiting until the markets behave the way they did when prices touched a strong resistance level is. When this happened, the downtrend began signalling a good time to start selling.
Enter trades based on price trends to protect against false breakouts
As I mentioned, knowing how price behaves when it touches a support/resistance allows you to have an idea about how to trade when it does this again.
So reading your chart is important. I usually recommend you trade using a larger time frame chart compared to your trading sessions. For example, If you are trading 5-minute candles, you should read the 30-minute or 3-hour chart.
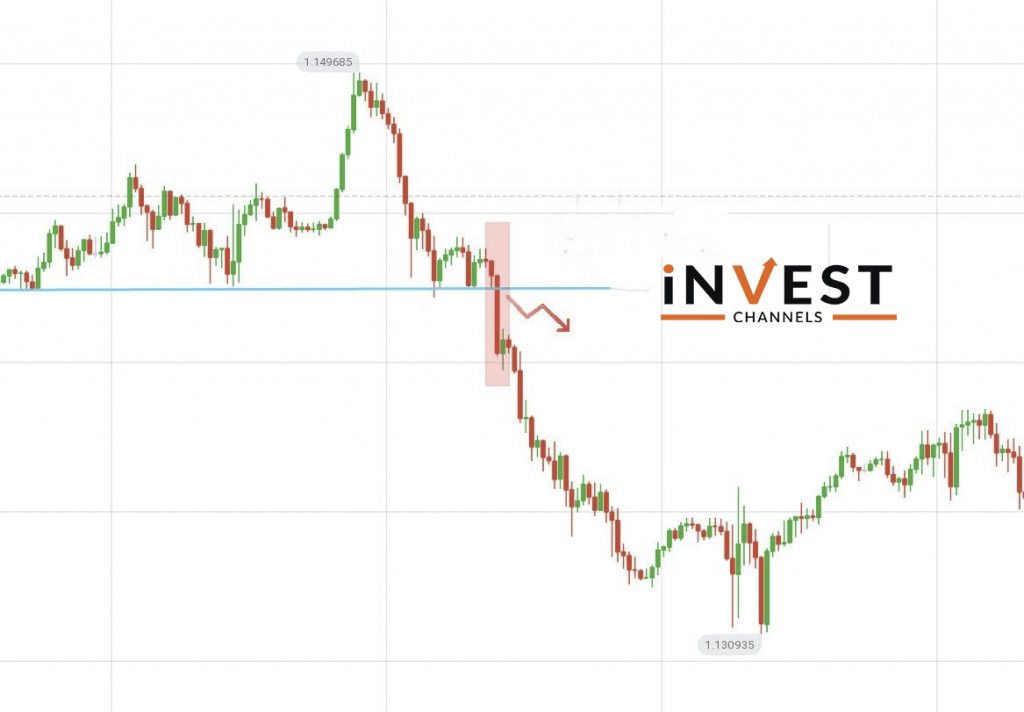
There are instances where the price continuously breaks through the support/resistance levels. You can use additional tools and indicators to help you determine when it’s best to enter your trades.
One useful tool is the IQ Option Bollinger Bands indicator. There are many ways to use this indicator. For example, when the price approaches the support/resistance zone before starting to fall and breaking the lower band, this is a signal to go short.
Trading using support/resistance is a skill that requires a lot of patience and practice. Your objective should be choosing the appropriate trade entry point once the price breaks the support/resistance.
If you want to apply these skills, open an IQ Option practice account today and start trading. It’s the only way you’ll learn how to identify support/resistance levels as well as determine when prices are about to break them.
Good luck!
Top 5 Trending
"Why do I keep losing money in trading?" This is a question every trader has asked at some point. Experiencing… [Read More]
Trading indices is more than just a financial pursuit; it's both an art and science, demanding attention to detail, a… [Read More]
Forget Tiffany’s—there’s a diamond that traders treasure even more. Diamond chart patterns may not sit on a ring, but they… [Read More]
The Psychological Line (PSY) Indicator is a versatile, oscillator-type trading tool that compares the number of periods with positive price… [Read More]
Have you ever felt like your trading approach could benefit from a little extra energy? That’s where the Relative Vigor… [Read More]


