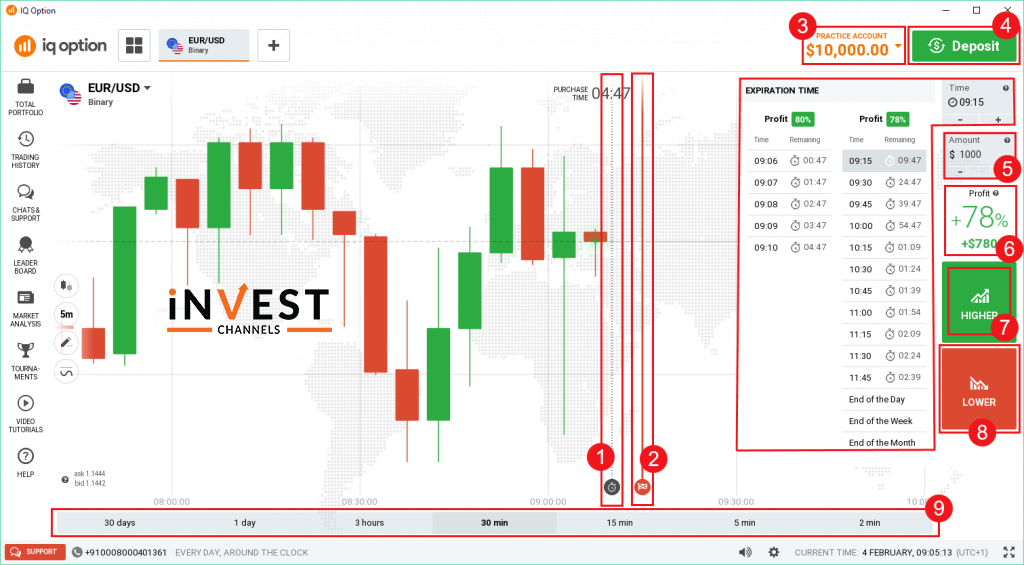
The one important thing to do after signing up for the IQ Option is to get familiar with their trading interface. You will the platform simple and easy to navigate. You do not have to struggle to find features and tools, you can find them easily on the interface.
You will learn about different features and their functions in this guide.
IQ Option features on the top and left of the interface

1. Open new instrument
The new instrument allows you to choose a new trading instrument you wish to trade with. If you want to see the different assets available for trading then click on the (+) sign to open it. The assets are cryptocurrencies, binary options, CFDs, Forex, and stocks.
2. Selected instruments
After you select your instrument to trade, it is then automatically be added at the top of your interface and if you click on it a real-time trading chart will open.
3. Multi-window view
The multi-window view will help you to open real-time charts of several instruments simultaneously. You can open up to 4 different multi-window views on the IQ Option platform with this handy feature.
4. Currently viewed the instrument
In the chart that you are currently viewing, this feature indicates just that.
5. Chart type
With the help of this feature, you can select the chart type while trading. You can find the chart like a Japanese candle, bar, line, and Heikin-Ashi chart types.
6. Time interval
With this feature, you can change the time interval, the single bar will last before another starts to develop.
7. Graphical tools
This tool is for technical analysis. You can use it to identify the chart techniques with the help of a trend line, a horizontal line, and Fibonacci lines.
8. Indicators
With the use of this feature, you can select the indicator you want to use for technical analysis. There are dozens of indicators ranging from oscillators to moving averages that IQ Option offers.
IQ Option features on the right and bottom side of the chart

1. Purchase time
This feature shows the remaining time before you are allowed to enter a trade. You can find this feature by a vertical dotted line with a small clock. If in case time expires, the countdown will start again and the line will move away from the prices.
2. Trade expiry
Depending on how long you hold position (when trading options) the price must touch this line for the trade to expire.
3. Account balance
The account balance will show you the remaining amount available in your trading account.
4. Deposit button
With this feature, you can make a deposit on your account. you can also use it to replenish your practice account if the virtual amount falls below $2000.
5. Amount
This is the amount that you wish to invest in your single trade. Just click inside the box and type in the amount to manually adjust it.
6. Expected return
This is the expected profit you will get if your trade is a winner.
7. Higher button
To enter a buy position, this feature can be used. Click on the button to enter a position if you think the price will be higher at trade expiry.
8. Lower button
This is used to enter a sell position. If you think the price will be lower at trade expiry, click on this button to enter a position.
9. Time interval bar
You can change the chart to reflect price changes over a specific period. For options, it will range between 30 days and 2 minutes.
Summary
IQ Option trading interface is not that complicated. You can easily find the features on the interface but you need to practice to get smooth hands-on it. So don’t wait and start on the IQ Option demo account.
Good luck!
Top 5 Trending
In the world of online trading — often filled with risk and uncertainty — verifying the credibility of a platform… [Read More]
Starting your trading journey can feel overwhelming — there are countless assets to choose from, and it’s hard to know… [Read More]
"Why do I keep losing money in trading?" This is a question every trader has asked at some point. Experiencing… [Read More]
Trading indices is more than just a financial pursuit; it's both an art and science, demanding attention to detail, a… [Read More]
Forget Tiffany’s—there’s a diamond that traders treasure even more. Diamond chart patterns may not sit on a ring, but they… [Read More]


