The main trade room window of IQ Option platform shows a chart of an asset.
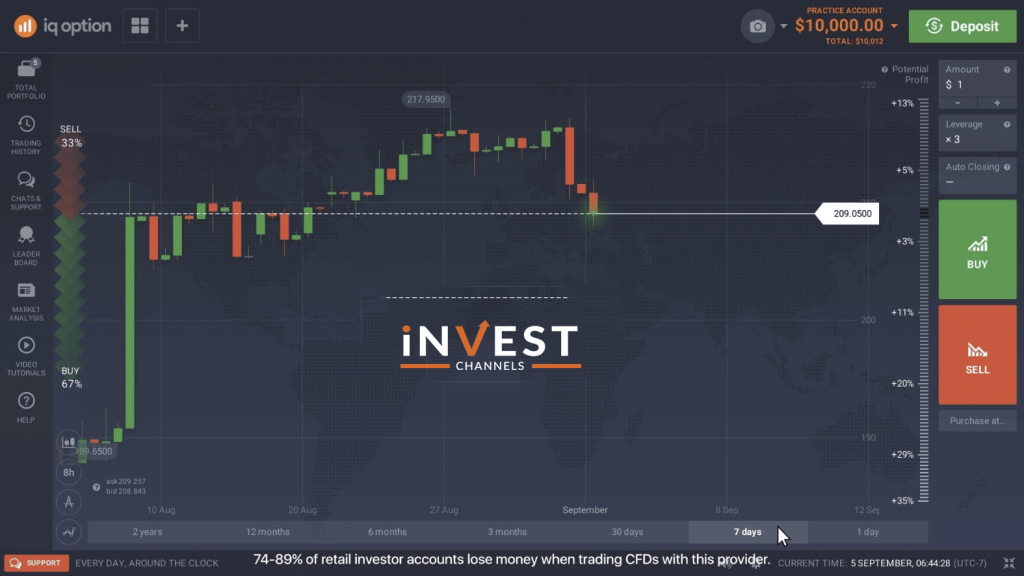
Just below the chart, you can see the time interval panel that allows you to view the price change of the chosen asset for a selected period of time.

You can also zoom in or zoom out of the chart as well as focus on the current price.
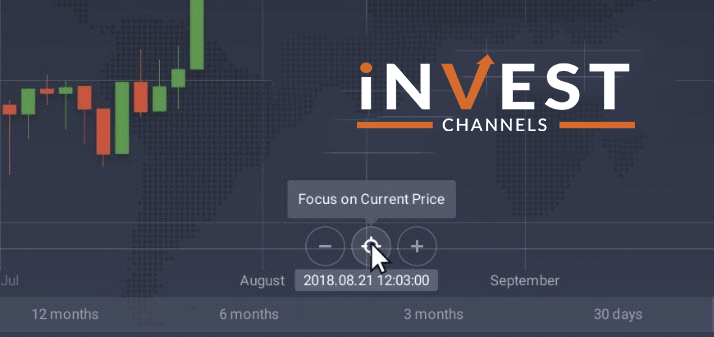
IQ Option trading interface
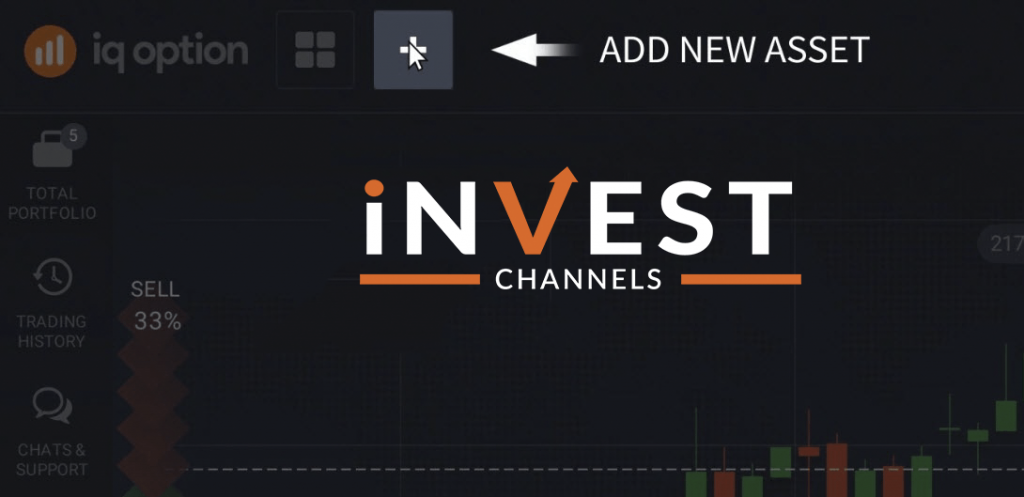
In order to select an asset or a trading instrument. Click on the trading instrument in the left upper corner of the chart or add a new asset by clicking on the plus icon on the upper panel.
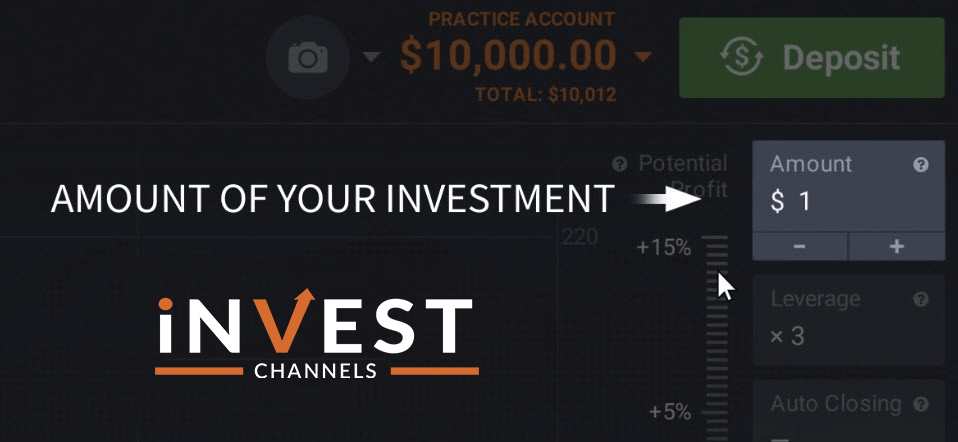
On the right-hand side panel. You can specify the amount of your investment by clicking the amount.
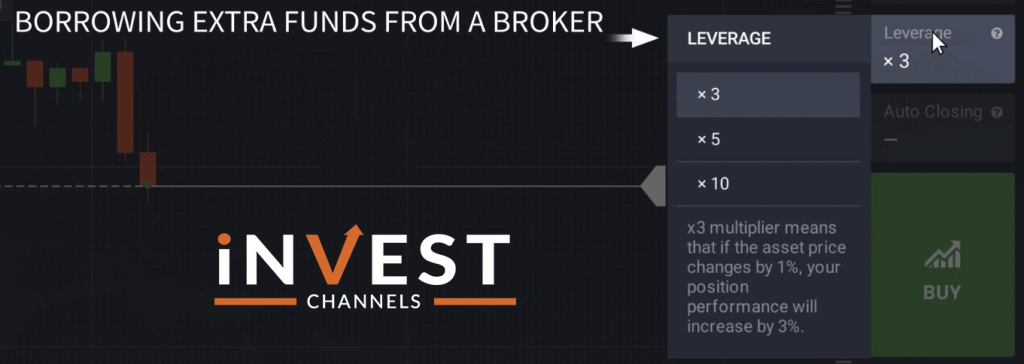
Just below it. You can see the leverage button which is available for stocks, forex, crypto, commodities and ETF. Leverage is used to borrow extra funds from a broker below you can see the green and red buttons that correspond to the price directions of an asset.
Technical analysis tools
On the left-hand side of the chart. The technical analysis menu is located.

It consists of four sections chart type, time interval, graphical tools and indicators. By clicking on the chart type icon you can select the chart type.
By clicking on the graphical tools icon you can select additional tools for drawing and creating technical analysis elements such as trends support lines and resistance lines.
By clicking on the indicators icon you can set up and apply various technical indicators that will help you conduct a market analysis. Here you can also customize various widgets to make your trading more efficient.

Portfolio management and extra features at IQ Option platform
The panel on the left-hand side of the chart window consists of several sections. Total Portfolio shows all your active and pending positions.
You can sort out the positions by type of instrument and see the statistics about all your active positions. In the trading history, you can keep track of all the deals you’ve made, see how much you’ve invested and what results you’ve made.
Charts and support are your channels of communication with other traders and our 24/7 support team. The leaderboard section shows their list of traders who have made the most profit on their real accounts over the past week.
The Market Analysis section provides you with news related to the companies whose stocks are available on our platform as well as various calendars. Video tutorials – there’s a section where you can find all our video materials including educational videos, news digests, reviews etc.
If you need assistance go to the help section and find answers to the most popular questions about our platform or trading or ask our Customer Support Specialist if you’ve not found an answer to your question.
Account management at IQ Option
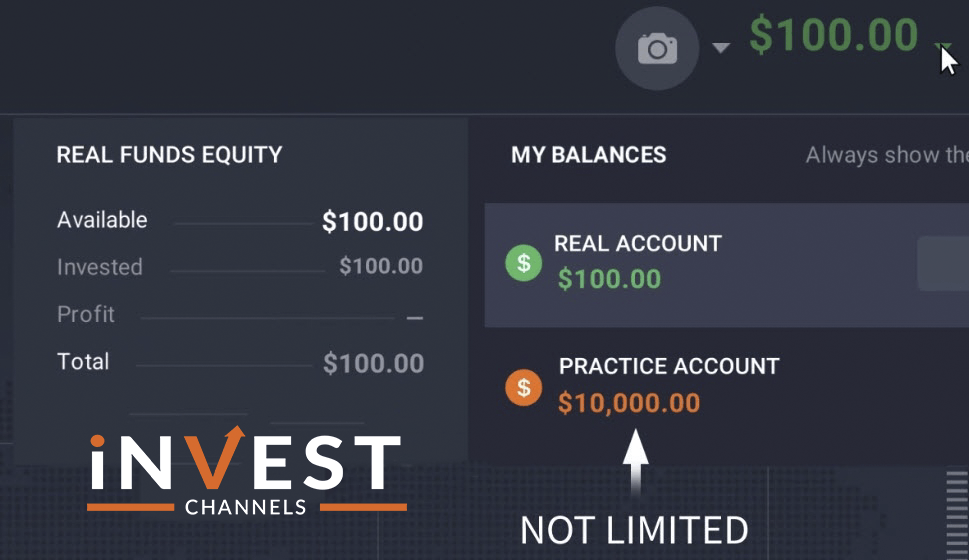
In the upper right corner just next to the deposit button, you can switch between practice and real account. The balance on your practice account is not limited.
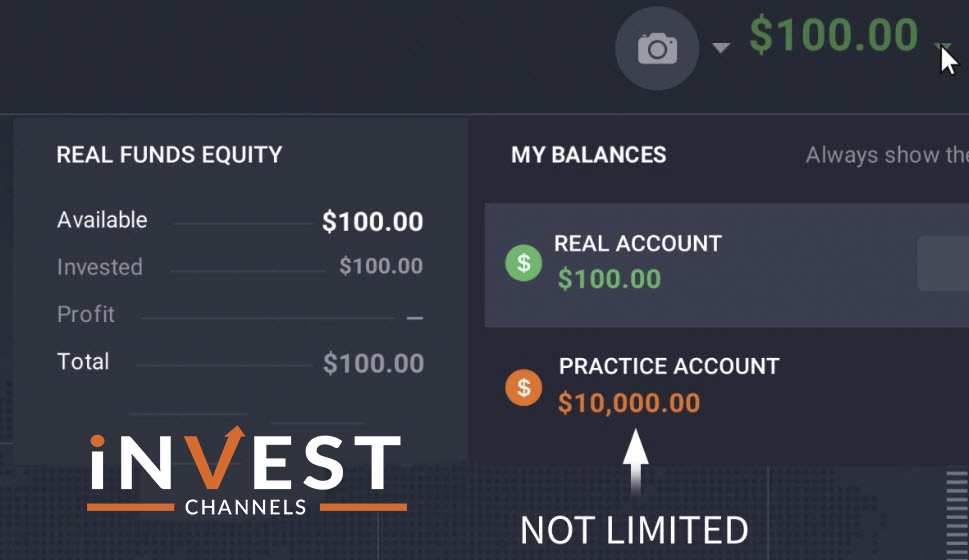
You can replenish it for free every time the balance goes below ten thousand dollars. To make a deposit, click on the deposit button. You will be redirected to the deposit window.
Detailed instructions on how to make a deposit at IQ Option are available in this article. If you are already trading on a real account and your funds are not sufficient for opening a new position, a deposit window will appear directly in the trade room.
In order to view or edit your IQ Option account settings, go to the account menu by clicking on the profile icon next to the account balance in the upper right corner.

Good Luck with your trade!
Top 5 Trending
"Why do I keep losing money in trading?" This is a question every trader has asked at some point. Experiencing… [Read More]
Trading indices is more than just a financial pursuit; it's both an art and science, demanding attention to detail, a… [Read More]
Forget Tiffany’s—there’s a diamond that traders treasure even more. Diamond chart patterns may not sit on a ring, but they… [Read More]
The Psychological Line (PSY) Indicator is a versatile, oscillator-type trading tool that compares the number of periods with positive price… [Read More]
Have you ever felt like your trading approach could benefit from a little extra energy? That’s where the Relative Vigor… [Read More]

