IQ Option is one of the leading online options brokers. They have a wide range of assets which include forex, commodities, stocks, indices, cryptocurrencies, options and digital options.
Options and digital options have a predetermined trade expiry. That is, once you enter a position, you expect it to last anywhere from one minute to one month. This short guide will teach you how to trade based on the trade expiry time provided by IQ Option.
Trade expiry for options
One of the features that make IQ Option stand out among options brokers is the length options positions can last. While most brokers will limit options positions to 1 day, IQ Option allows you to hold positions for up to 1 month. This comes in handy for traders who want to hold long positions.
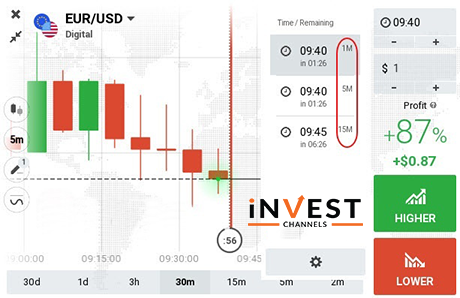
The minimum time you can hold an options position is 1 minute. Trades lasting between 1 minute and 5 minutes usually have a higher return than those lasting 10 minutes to 1 month.
Trade expiry for digital options
IQ Option digital options positions can last 1 minute, 5 minutes or 15 minutes. When trading digital options, you’ll need to predict not only the direction of the asset’s price but also how far prices will move from the strike price.
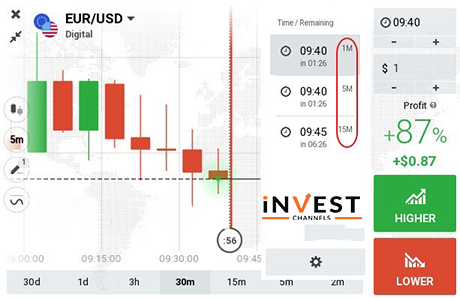
Chart features you need to be familiar with when trading options and digital options
Time feature
This is found at the right-hand side of your trading interface. This indicates the trade expiry. The default is set at 1 minute for both options and digital options. You can increase the time to expiry by clicking on this feature. The possible expiry will then be displayed allowing you to choose the expiry you prefer.

Trade open countdown
This is a white dotted vertical line that appears on the price chart. This line indicates the amount of time you have left to open a position. Once the timer reaches zero, the countdown starts at 60 seconds. As long as the timer hasn’t reached zero, you can open as many positions on the specific asset you’re trading.
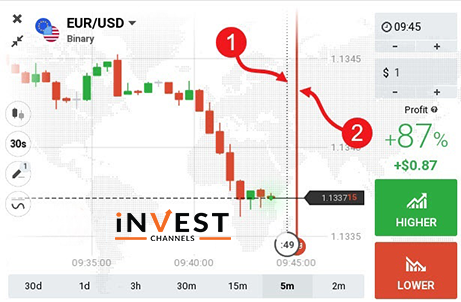
Trade expiry
This is a red vertical line that also appears on your price chart. It also includes a countdown clock which indicates the number of minutes or seconds remaining before the options trade expires. Once the price touches this line, the position is automatically closed.
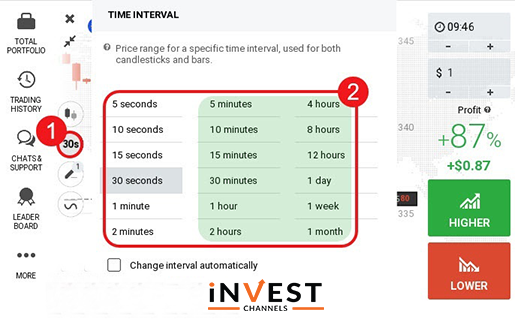
Candle/bar time interval
When trading using bar or candle charts, the time interval represents how long it takes for a candle to open and close. The candle and bar time intervals on IQ Option range from 5 seconds to 1 month.
Tips for trading options and binary options
I recommend using Japanese candle charts when trading. They are easier to read and analyze compared to line and bar charts.
Use 5-minute interval candles. These give you a better picture of how the prices are moving compared to candles lasting 5 seconds to 1 minute which fluctuate frequently.
Your trades should last 5 minutes or more.

If possible, use simply to read indicators such as the SMA, RSI or Bollinger bands for technical analysis. These indicators make it easier to identify trends and their reversals allowing you to make more accurate predictions.
Good luck!
Top 5 Trending
"Why do I keep losing money in trading?" This is a question every trader has asked at some point. Experiencing… [Read More]
Trading indices is more than just a financial pursuit; it's both an art and science, demanding attention to detail, a… [Read More]
Forget Tiffany’s—there’s a diamond that traders treasure even more. Diamond chart patterns may not sit on a ring, but they… [Read More]
The Psychological Line (PSY) Indicator is a versatile, oscillator-type trading tool that compares the number of periods with positive price… [Read More]
Have you ever felt like your trading approach could benefit from a little extra energy? That’s where the Relative Vigor… [Read More]

