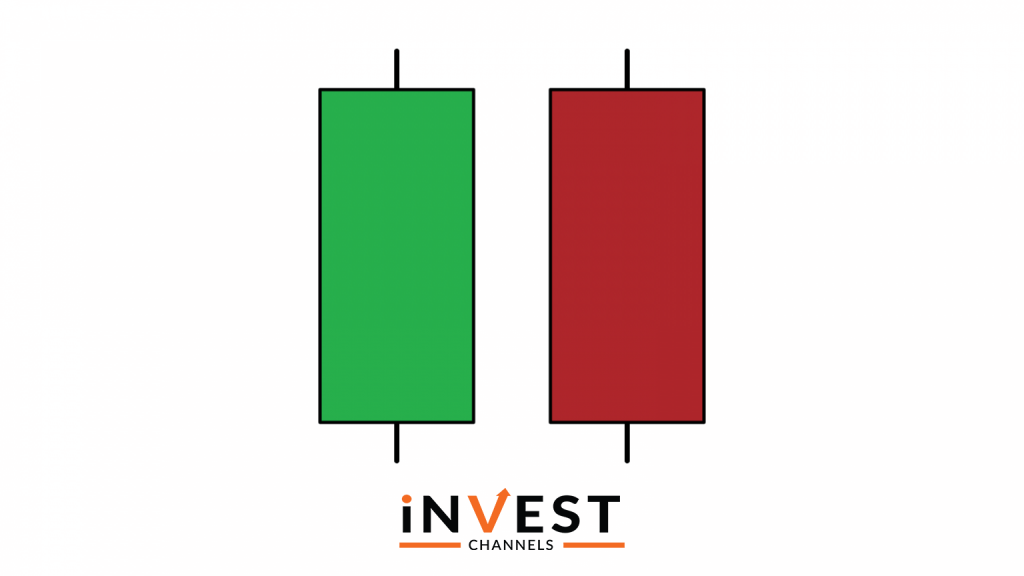
One of the most popular trading charts is the Japanese candle sticks. It’s easy to read and know whether the markets are trending or ranging. Each candle in the chart tells a story. Correctly interpreting this story will be important in your trading career. This guide will look at the different types of candles as well as the stories they tell.
How the Japanese candle stick is formed
Each candle stick is formed over a specific time frame. In IQ Option, this time frame ranges between 5 seconds and 1 month. For example, a 5 second candle stick develops for only 5 seconds before another 5 second candle stick starts developing. This sequence of candles is what creates the price pattern on your chart.
As the candle develops, you’ll notice that its size changes continuously. These changes are a result of price fluctuations occurring during the lifetime of the candle. However, each candle only captures four price points over its time frame, the opening price, the closing price, the highest price and the lowest price of the period covered.
The anatomy of the candle stick as it appears on IQ Option
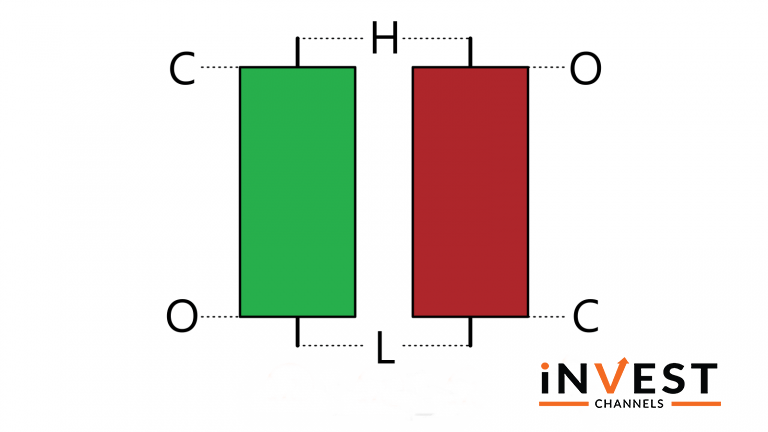
The wick on the other hand appears on either or both ends of the body. Sometimes, you will come across candles without wicks. The wicks ends represent the highest and lowest prices of the session.
At IQ Option, the green candle is bullish and the orange candle is bearish candle.
The different types of candle sticks you’ll find on IQ Option
The Marubozu Twins
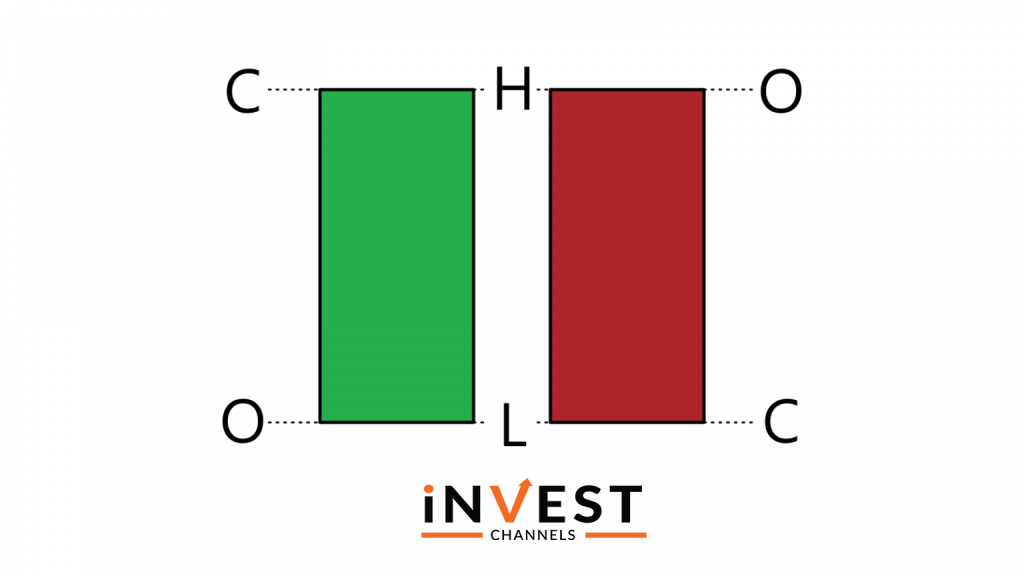
The Marubozu Twins are solid body candles. That is, they have no shadows. The open and close of the trading session represent the high and low prices of that session respectively. The bullish Marubozu is green in color while the bearish Marubozu is orange in color. These candles develop when the market is in a period of high volatility.
On the IQ Option platform, look out for these candles. They usually develop after some economic news or event affects the instrument being traded. Trading in their direction can reap good returns.
Spinning tops
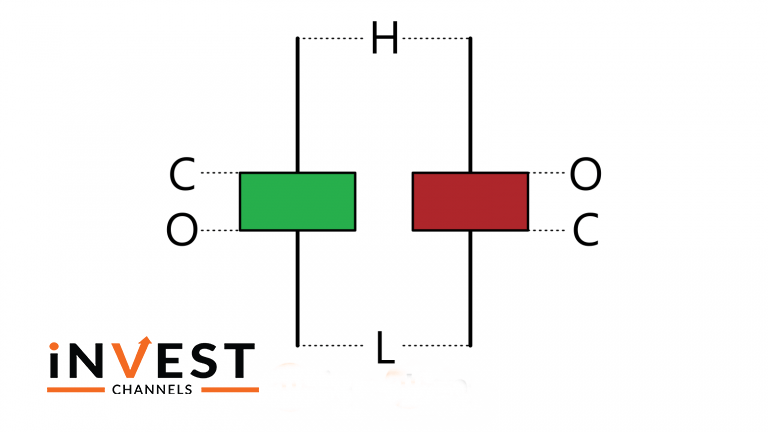
The spinning top has a small body with small wicks. These candles form when there’s indecision in the market. They are an indicator that one side is losing to the other. For example, if a spinning top develops in an uptrend, it’s an indicator that the bulls are losing their market dominance. As such, spinning top candles can also suggest an imminent trend reversal.
The Doji
This is also an indecision type candle. They look like a plus sign and in other instances look like a “T” or inverted “T”. When a doji forms, it simply indicates that the buyers and sellers are equally matched.
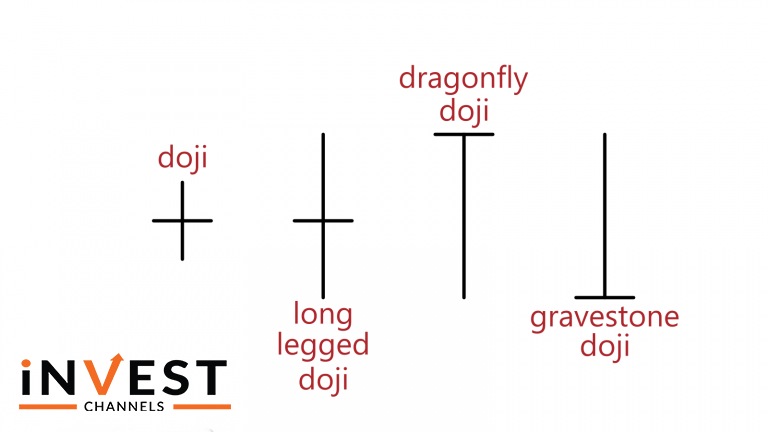
The doji can be part of a trend continuation pattern or trend reversal pattern. How you interpret it will be based on the previous candles.
Now let’s discuss the 4 types of doji candles you’ll find on the IQ Option platform.
The neutral doji
This doji looks like a plus sign. The opening and closing prices are the same. The wicks are also more or less equal in length. This shows that the bulls and bears are equally matched.
Long legged doji
It’s also an indecision candle. However, the wicks are longer compared to those of the neutral doji. Here, the opening and closing prices are the same. However, the session’s high and low are further apart meaning the battle between bulls and bears was more intense.
Dragonfly doji
This candle looks like the capital letter “T”. It’s a rare candle and forms at the top of an uptrend. The opening and closing prices are around the same level. This candle forms when bears have control over most of the trading session but bulls step in driving the prices higher before the session closes. To trade this candle, enter into position when the price breaks the top of the candle. In addition, place your stop at the bottom of the doji.
Gravestone doji
This is a bearish reversal doji and appears like an inverted capital letter “T”. Here, the bulls controlled much of the trading session before the bears step in and drive prices down. The opening and closing prices are therefore more or less at the same level. This candle formation usually appears at the bottom of a downtrend and indicates an impending reversal.
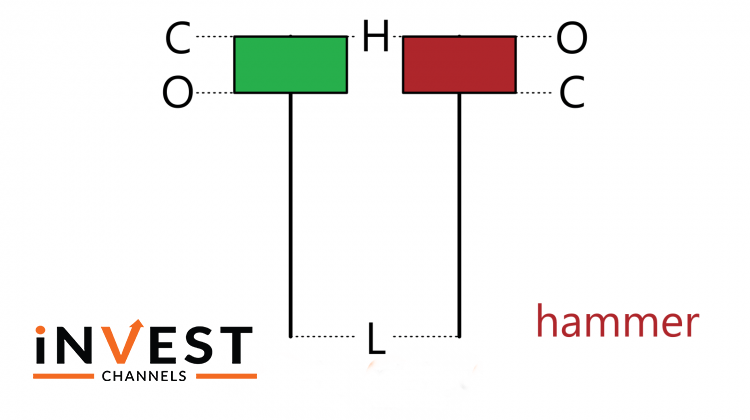
Hammer twins
The hammer twins are bullish reversal candles. The hammer has a small full body with a long wick at the bottom. It forms along an uptrend and signals that the trend is continuing.
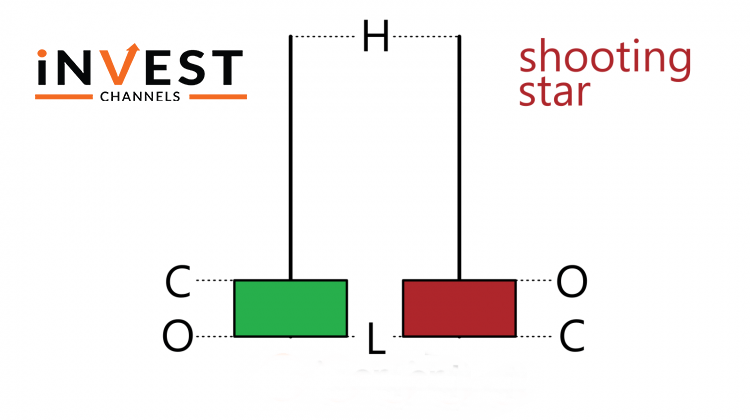
Its opposite is the inverted hammer which has a small body with a long wick at the top. They usually form at the bottom of a downtrend. When you encounter this type of candle, you can expect the market to reverse to an uptrend.
Although candles can be used alone, you can also use them alongside other trading tools and indicators. Now that you know which candle sticks to look out for on the IQ Option platform, open a demo account today and try out these candle stick strategies at IQ Option.
Conclusion
Candles are one of the best patterns to use when trading on IQ Option. Each candle tells a story, especially when used with one or two candles that form before it. If you have a good grasp of reading candles, making money from IQ Option should become easy for you.
Good luck!
Top 5 Trending
In the world of online trading — often filled with risk and uncertainty — verifying the credibility of a platform… [Read More]
Starting your trading journey can feel overwhelming — there are countless assets to choose from, and it’s hard to know… [Read More]
"Why do I keep losing money in trading?" This is a question every trader has asked at some point. Experiencing… [Read More]
Trading indices is more than just a financial pursuit; it's both an art and science, demanding attention to detail, a… [Read More]
Forget Tiffany’s—there’s a diamond that traders treasure even more. Diamond chart patterns may not sit on a ring, but they… [Read More]

