MACD indicator overview
The Moving Average Convergence Divergence (MACD) is a trend-following and momentum indicator. It’s one of the simplest and most effective indicators to use when trying to identify trends and possible trade entry points. This indicator has two moving averages that oscillate above and below a centre zero line.
This guide will teach you how to set up the MACD indicator and use it to trade on IQ Option.
Setting up the MACD indicator on IQ Option

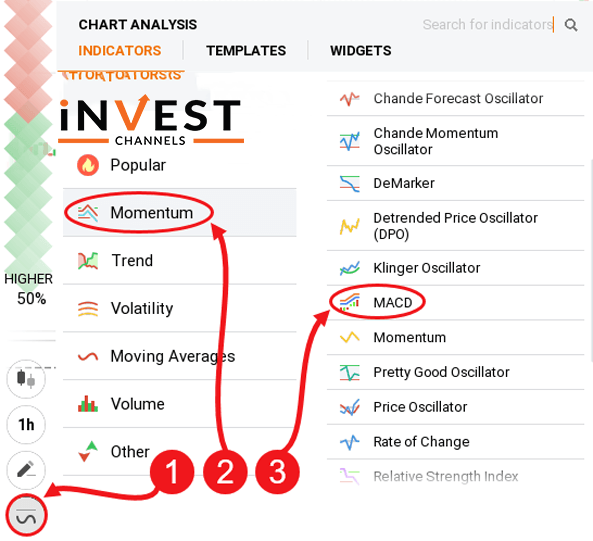
After logging into your IQ Option trading account, set up your candlesticks chart. Next, click on the indicators feature and select Momentum. Finally, select MACD. This indicator comes with the settings of 12, 26 and 9. Leave them as they are.
Understanding how the MACD indicator works

The MACD indicator is all about the convergence and divergence of the two moving average lines. The EMA12 line reacts to price changes faster than the EMA26 line.
The convergence or divergence of these two moving averages is a signal that a trend is developing (or not).
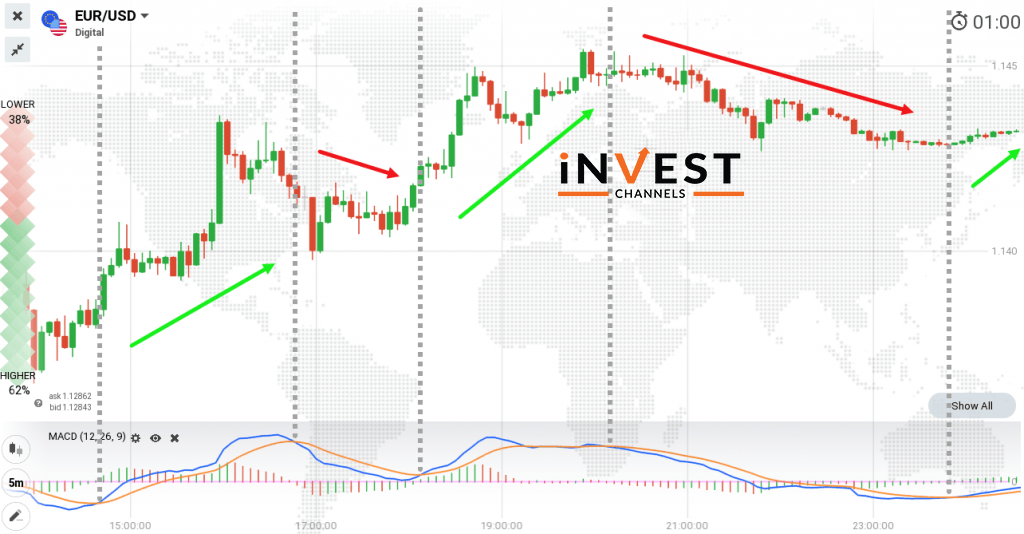
When the EMA12 crosses above the EMA26, and move above the zero line, this is a positive divergence. As the gap between the two lines increases, the stronger the upward price momentum becomes. At this point, you should enter a buy position.
When the EMA12 crosses below the EMA26 and moves below the zero line, a negative divergence is occurring. As the gap between both MAs increases, so does the downward momentum of the prices. At this point, you should enter a sell position.
MACD divergence
MACD divergence occurs when the two moving average lines seem to fall while the prices are rising and vice versa. This phenomenon signals a potential trend reversal. Trading MACD divergences isn’t advisable. It’s best to wait until the MACD indicator signals a clear trend.
The MACD indicator is one of the best tools you can use to identify trend reversal signals. Now that you’ve learned how to set it up and use it, try it out on your IQ Options practice account today.
Good Luck!
Top 5 Trending
"Why do I keep losing money in trading?" This is a question every trader has asked at some point. Experiencing… [Read More]
Trading indices is more than just a financial pursuit; it's both an art and science, demanding attention to detail, a… [Read More]
Forget Tiffany’s—there’s a diamond that traders treasure even more. Diamond chart patterns may not sit on a ring, but they… [Read More]
The Psychological Line (PSY) Indicator is a versatile, oscillator-type trading tool that compares the number of periods with positive price… [Read More]
Have you ever felt like your trading approach could benefit from a little extra energy? That’s where the Relative Vigor… [Read More]


