
We have already discussed that on IQ Option, holding long positions makes a higher probability of winning trades. But before entering into a long trade you must know the direction of price. In this guide, you will learn about 3 different indicators that accurately predict the trend reversal which will help you to win the trade.
Create an indicator template consisting of EMA, MACD and Parabolic SAR
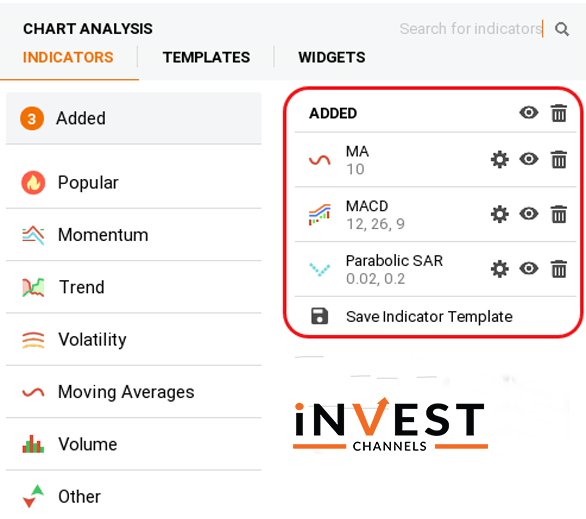
Firstly, after logging in, set up each indicator individually and then click on the “Added” feature on the indicators tab. This will give you a list of all added indicators. Now click on the “Save indicator template” at the bottom.
By this, you can use the set of 3 indicators in your future trades, without setting them up individually.
Make changes in the indicator’s setting according to your trading strategy and preferences if you are using 30-minute intervals then you can change the settings as used EMA10 and MACD 12, 0.26, and 9.
On your trading chart, use 5-minute interval Japanese candles.
Trading using EMA, MACD and Parabolic SAR on IQ Option
Always wait until you observe clear market fluctuations as this set of indicators work best when trading trend reversals. So, whenever the trend reversal occurs, all three indicators will signal it.
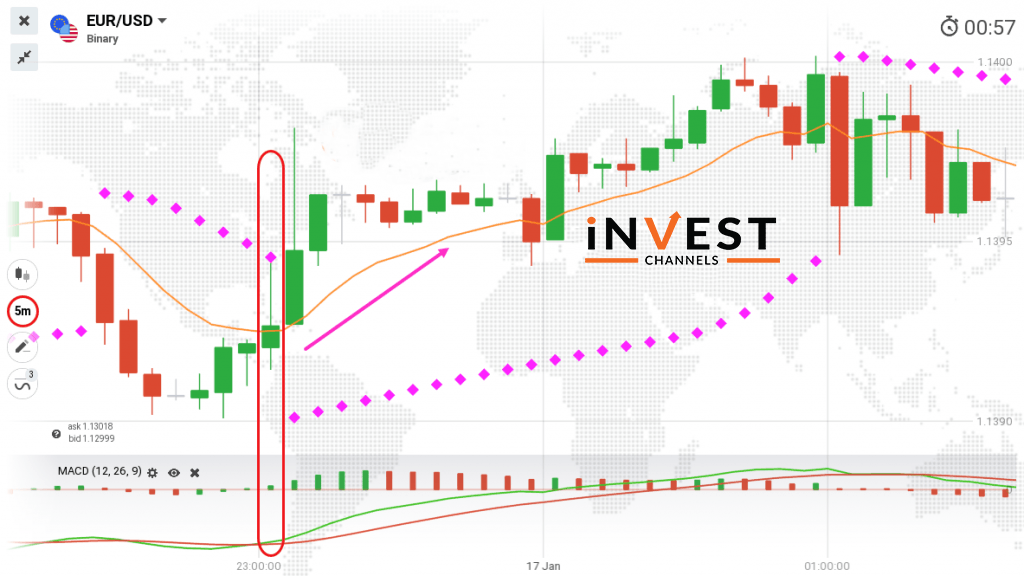
When to enter a long buy position
Here it is necessary for the green line to cross the red line. And the chart will develop a bullish candle(green) at the same time. The EMA10 cuts through the bullish candle and moves under the prices. In the end, the Parabolic SAR stops above the prices, breaks, and starts moving under the prices.
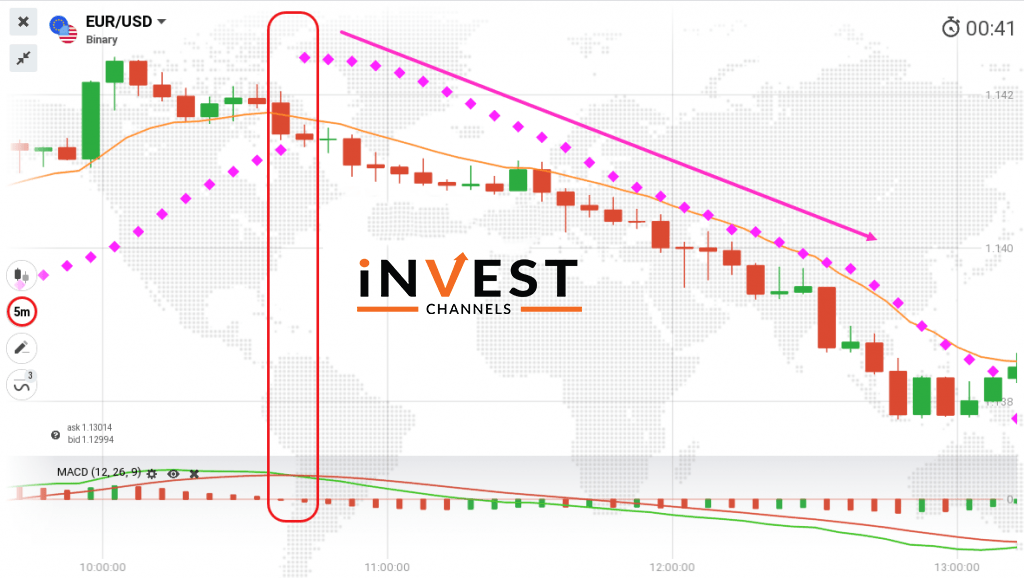
When to enter long sell positions
In the chart, the green MSDA line must cross under the red line. A bearish candle is developed by the chart and EMA10 cuts across and starts moving above the prices. Finally, Parabolic SAR stops and break into the prices and start moving above the prices.
This is a good process to identify when the trend is reversing and place long trades. Also, your trade should last for 30-minutes if you are using a 5-minute interval candle.
Now that you’ve learned how to use this set of indicators, try them out on the IQ Options practice account. Share your results in the comments section below.
Good luck!
You might also want to read


Top 5 Trending
"Why do I keep losing money in trading?" This is a question every trader has asked at some point. Experiencing… [Read More]
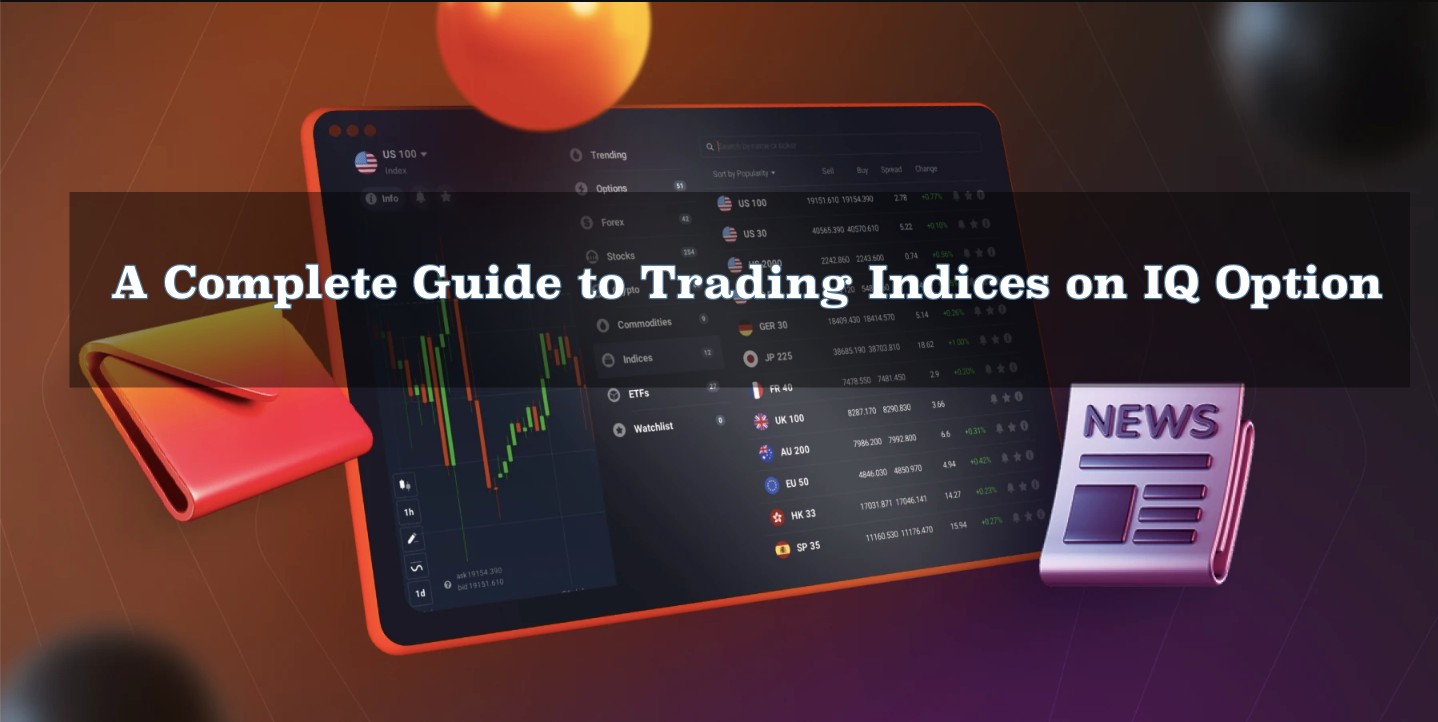
Trading indices is more than just a financial pursuit; it's both an art and science, demanding attention to detail, a… [Read More]
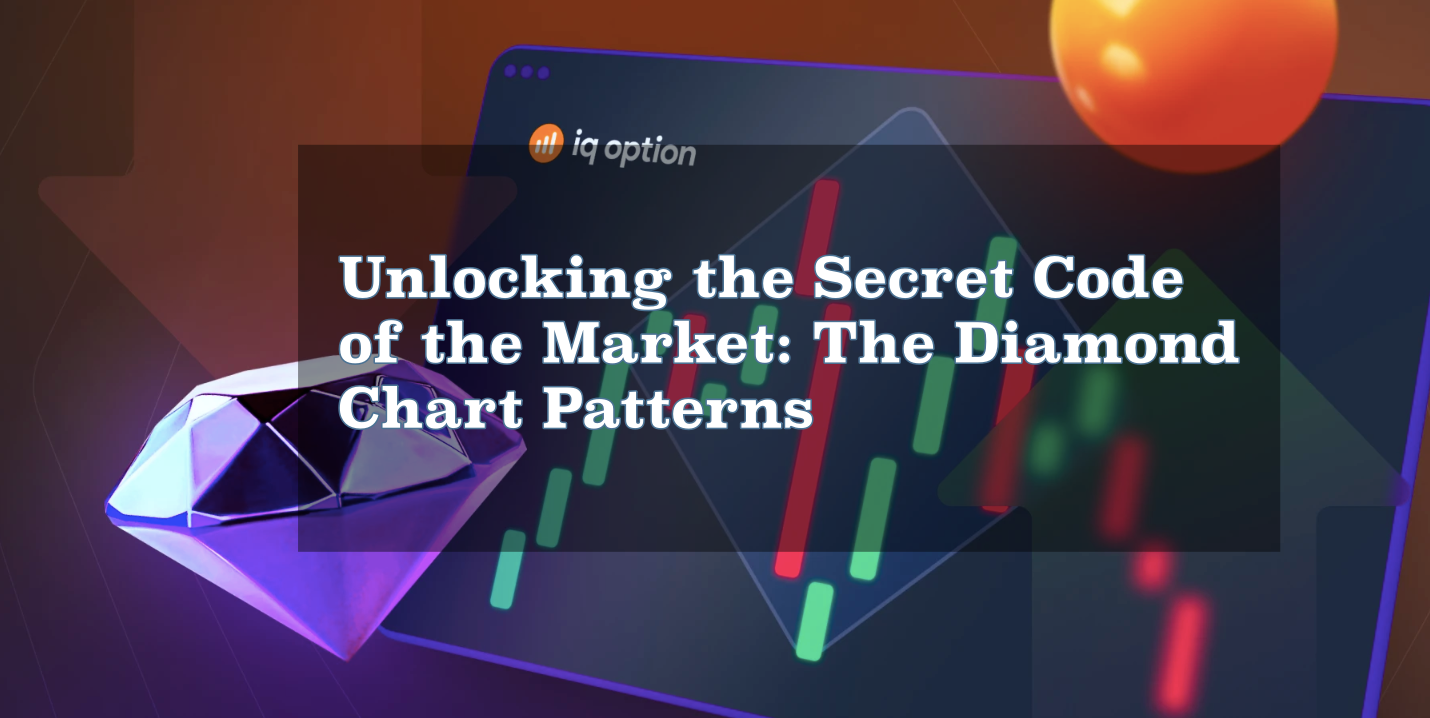
Forget Tiffany’s—there’s a diamond that traders treasure even more. Diamond chart patterns may not sit on a ring, but they… [Read More]
The Psychological Line (PSY) Indicator is a versatile, oscillator-type trading tool that compares the number of periods with positive price… [Read More]
Have you ever felt like your trading approach could benefit from a little extra energy? That’s where the Relative Vigor… [Read More]