Mathematics of moving average
An average indicator is the main indicator that shows the direction of price movement. Candlestick quantity is used to measure the mathematical pricing average of a period when we process moving averages. Let us take an example to understand it, suppose, you want to calculate the value of 5 candlestick periods, The indicator will divide the sum of closing values by 5. Next, the indicator will move forward to calculate in the same manner.
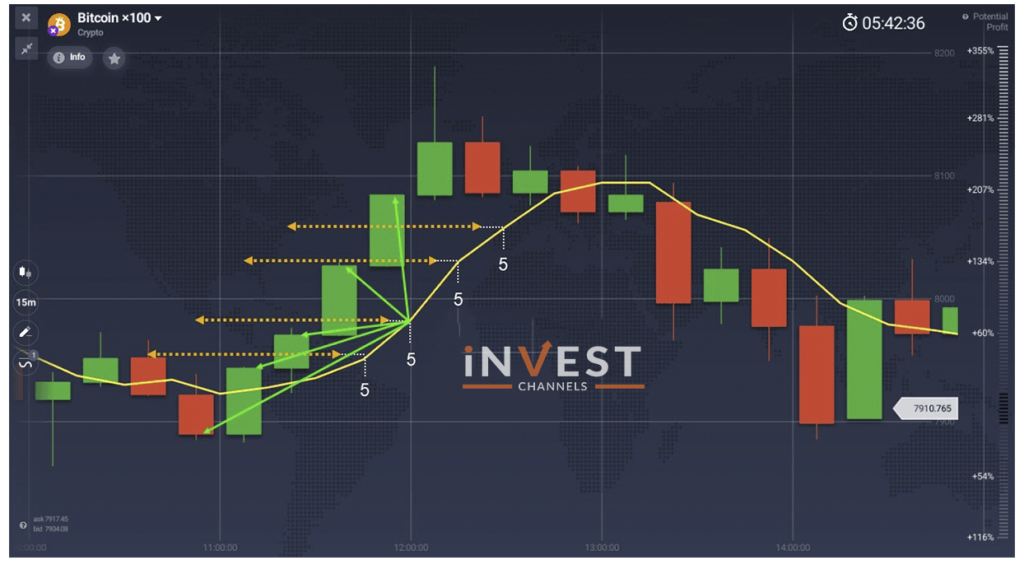
To have a smooth chart direction, a trader can build up a line of resulting values. It indicates the current trends to smooths price bursts.

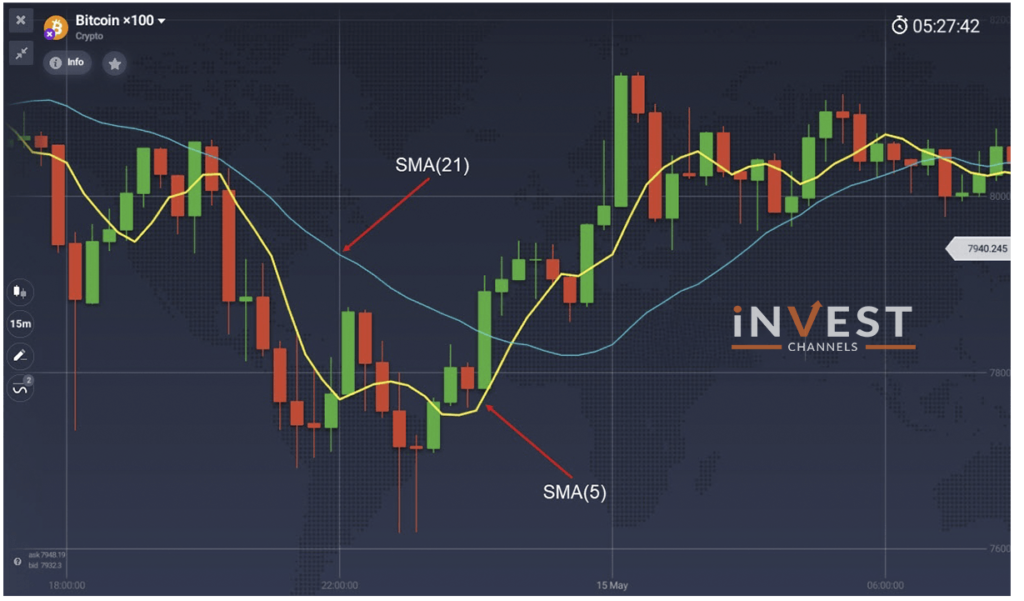
The price sensitivity lowers when the period increases. But the lag on the price chart increases. There is an option for you to choose the candlesticks period in the indicator settings.
Types of moving average
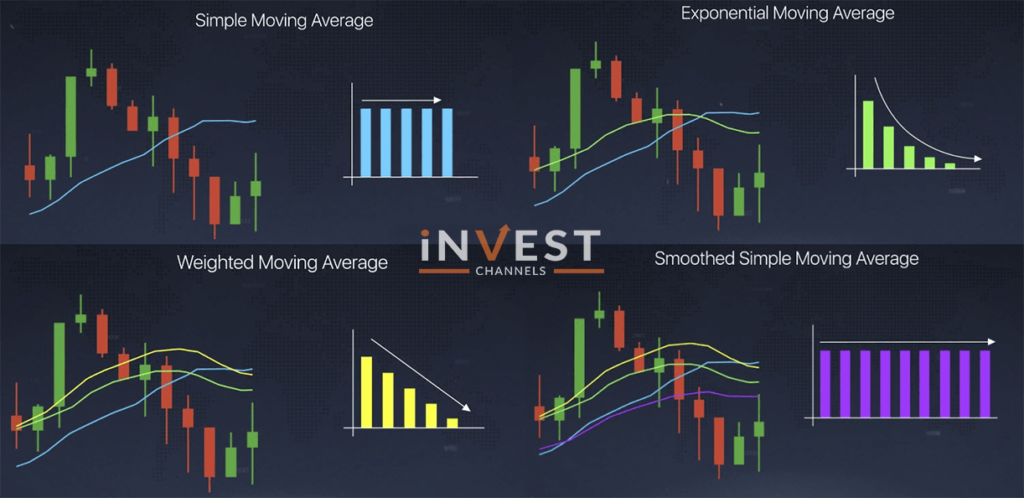
Simple moving average
An average arithmetical value for a given period is simple moving average or SMA
Exponential moving average
EMA or exponential moving average takes the current average value in the account on a preceding period with smoothing and the priority never equals zero and decreases exponentially.
Weighted moving average
The weighted moving average or WMA appoints top priority to the current price that is the reason why WMA does not depend on dated prices and the priority of importance increases linearly.
Smooth simple moving average
The smooth simple average is much smoother as compared to other moving averages. SSMA take many candlesticks throughout historical quotes.
How to use the moving average indicator
If you want to detect a lateral trend then moving average is a great instrument. Also, it determines trend reversals when two indicators with different time intervals intersect.

Good luck!
Top 5 Trending
"Why do I keep losing money in trading?" This is a question every trader has asked at some point. Experiencing… [Read More]
Trading indices is more than just a financial pursuit; it's both an art and science, demanding attention to detail, a… [Read More]
Forget Tiffany’s—there’s a diamond that traders treasure even more. Diamond chart patterns may not sit on a ring, but they… [Read More]
The Psychological Line (PSY) Indicator is a versatile, oscillator-type trading tool that compares the number of periods with positive price… [Read More]
Have you ever felt like your trading approach could benefit from a little extra energy? That’s where the Relative Vigor… [Read More]

