There are many trading patterns that are named after some animals like ats and butterflies but have ever heard about a pig’s hoof pattern? Yes, there is a trading pattern that works for all types of traders and that is a pig’s hoof pattern.
In this guide, you will know about the pig’s hoof pattern and how to use it.
Overview of the Pig’s Hoof pattern
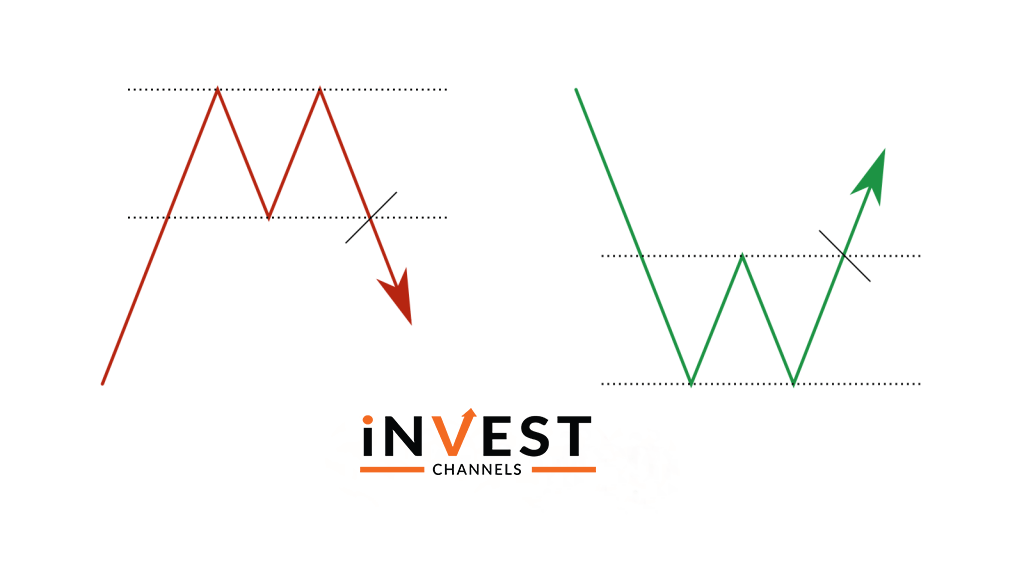
As the name says pig’s hoof, this pattern is quite similar to that. This pattern occurs when the price hits a support or resistance reverses and again hits the support or resistance before reversing and taking a trend. You can find the below pictures helpful.
Note that this pattern will only form when there is an RSI divergence. The RSI chart will drop when the price will rise and vice versa.
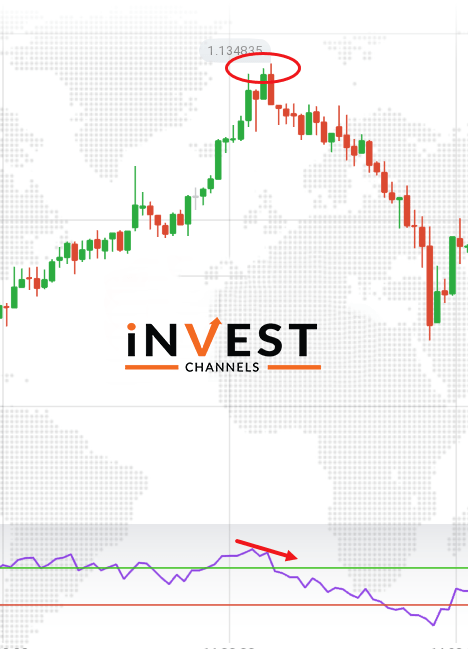
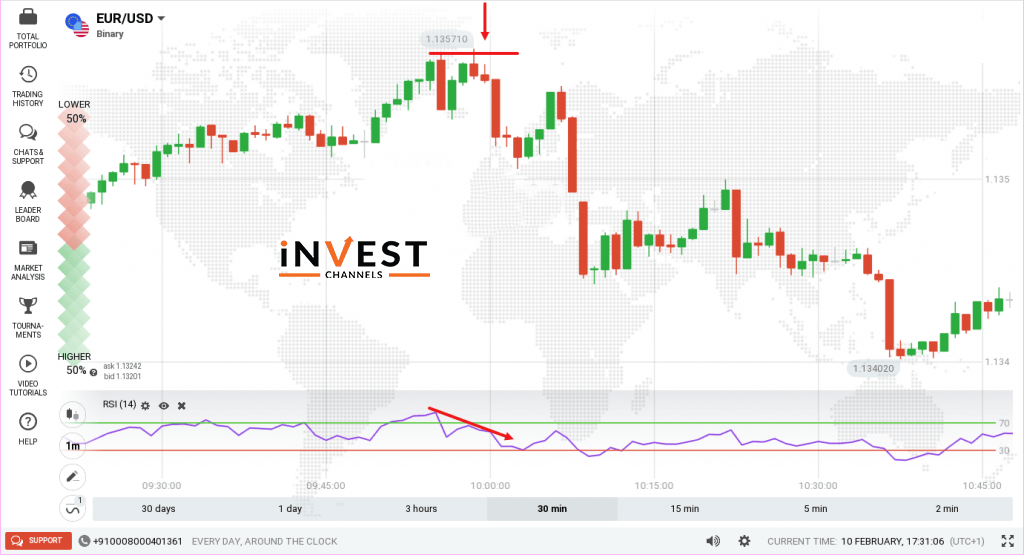
Bearish RSI divergence
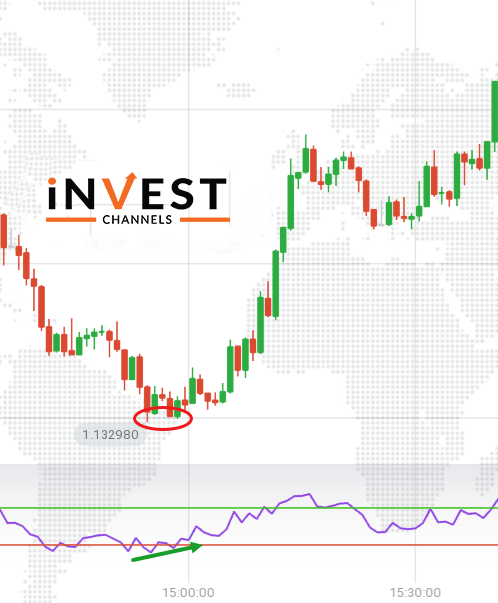
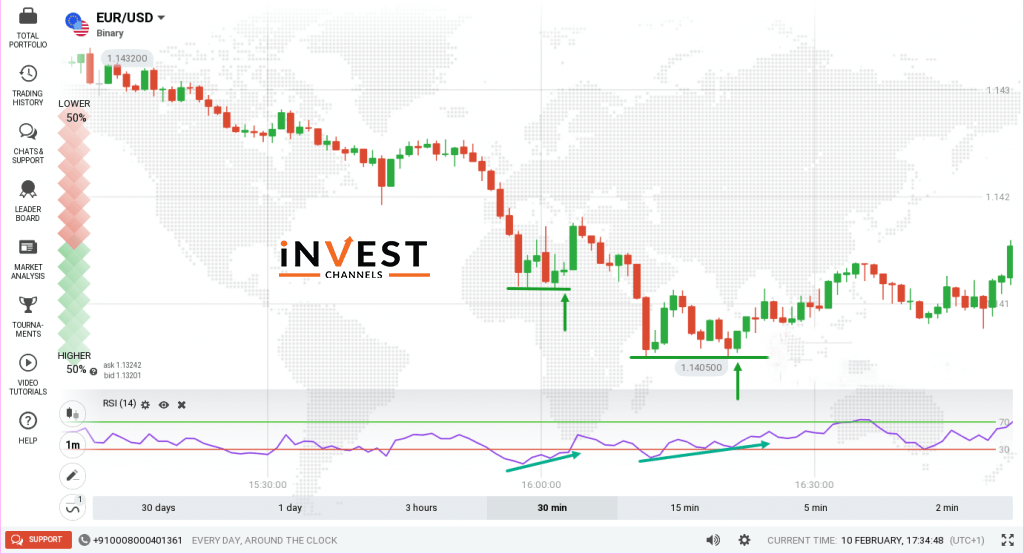
Bullish RSI divergence
In both images, you’ll notice that the price hits the support/resistance level then temporarily reverses before moving to the support/resistance. Finally, it reverses adopting a strong reverse trend.
There is an RSI divergence where the prices bounced to support/resistance for the second time, the RSI didn’t move in the same direction.
How to trade using the Pig’s Hoof pattern on IQ Option
Now, to trade using pig hoof’s pattern, log in to the IQ Option account. After logging in set up the Japanese candle chart. And wait for candles to have a 1 minute time interval.
After that, set up your RSI indicator by clicking on the indicator’s feature. Next, select momentum and finally set it up by selecting the Relative Strength Index.
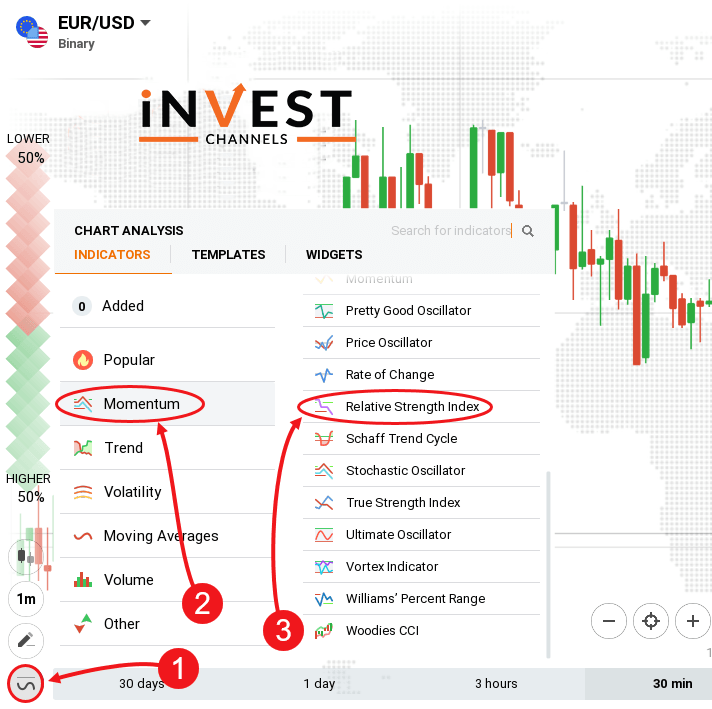
How to trade
While using the pig’s hoof method you need to look out for three things that are, the price trends that bounce off resistance level, special candles that form on the support, or resistance indicating a possible reversal. And the last one is the RSI indicator diverges. This means that when the prices will hit the support/resistance and bounce back, the RSI line will not do the same.
Enter buy positions when RSI divergence occurs during a downtrend. Your trades should not last longer than 5 minutes if you’re using 1-minute candles.
Enter into a sell position when RSI divergence occurs during an uptrend.
Easy money management method you can use alongside this strategy
Money management is an important part of a trading strategy. This money management strategy will help you to make money using compounding.
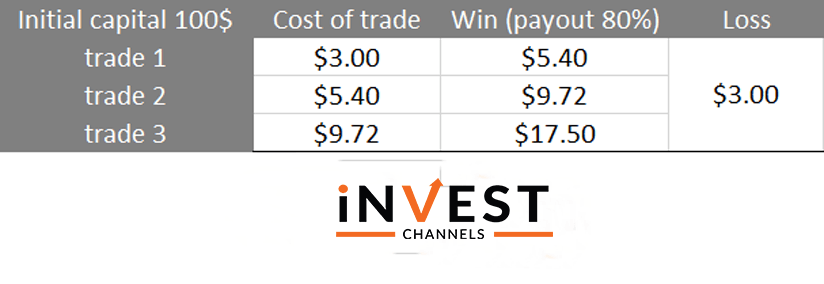
The first thing to remember is that do not trade more than 3%of the total account balance in a single transaction. For example, if you have $100 then the maximum amount to invest in your first trade should be $3.
Now, after the successful trade, instead of investing again $3, invest your total earnings on the next trade.
Factoring in Trading psychology
It is most important to know how much psychological pressure you can take. You must prepare yourself for that as it can be demanding.
Take the above example, what you lose in all 3 trades? Your account balance will be $91. So, would you continue trading and try to recover $9 or leave the market?
And what if all your 3 trades are winners? Would you continue trading in hope that you’ll make more money?
Being prepared means that you should know when to stop trading. Whether you lose or win, set the number before start trading and stick to your plan.
Advantage of trading using the pig’s hoof pattern on IQ Option
The main advantage of using this method is that it is really effective. This pattern will work when the aforementioned 3 conditions are met – special candles appear on support/resistance, there’s a trend and RSI divergence occur.
At the time of the trending market, this pattern works very well with several reversals occurring over a period of time.
Coupled with the money management strategy I’ve shared with you; you’ll only need a few trades per day to reach your daily profit target.
Disadvantages of the pig’s hoof trading pattern
Pig’s hoof pattern only works with short interval candles. Also, it takes a lot of patience for the pattern to present itself.
Now that you’ve earned how to trade using the pig’s hoof pattern, try it out on your IQ Options practice account. Share your results in the comments section below.
Good luck!
Top 5 Trending
"Why do I keep losing money in trading?" This is a question every trader has asked at some point. Experiencing… [Read More]
Trading indices is more than just a financial pursuit; it's both an art and science, demanding attention to detail, a… [Read More]
Forget Tiffany’s—there’s a diamond that traders treasure even more. Diamond chart patterns may not sit on a ring, but they… [Read More]
The Psychological Line (PSY) Indicator is a versatile, oscillator-type trading tool that compares the number of periods with positive price… [Read More]
Have you ever felt like your trading approach could benefit from a little extra energy? That’s where the Relative Vigor… [Read More]

