

There’s no doubt that support and resistance levels are important for technical analysis when trading. However, their true effectiveness is seen when combined with other indicators or specific candles on your chart. This guide looks at using supports and resistance alongside pin bar candles to trade trend reversals on the IQ Option platform.
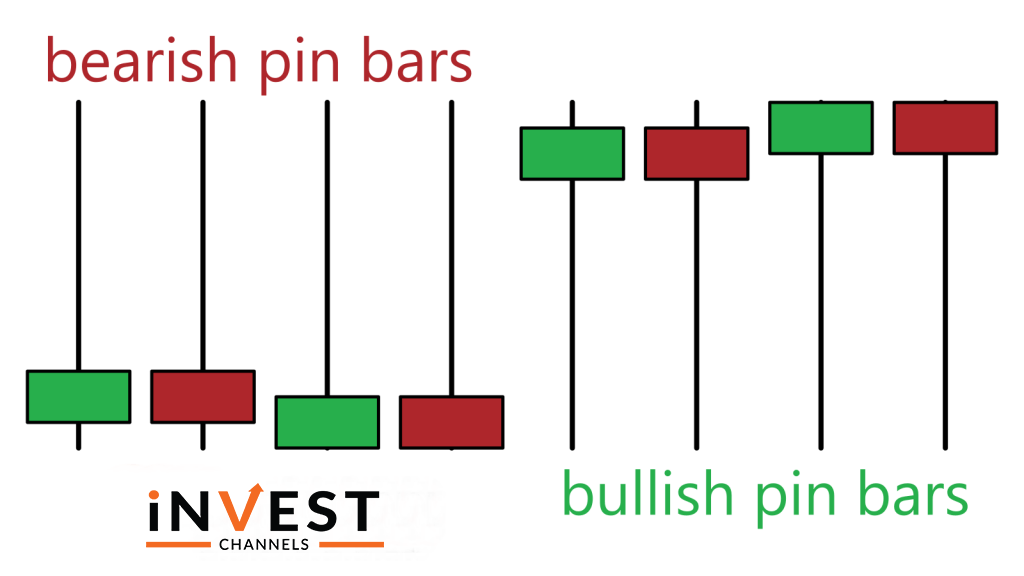
Overview of the Pin Bar candles
Pin bar candles are a special type of candle. They consist of a fairly small body with a long wick either at the top or bottom of the body. The long wick is at least twice the size of the body. The opposite end of the body might have a small wick. Pin Bar candles can be either bearish or bullish.
Importance of knowing the Pin Bar when trading
Pin Bar candles form when the battle between bulls and bears is intense. For bearish pin bars, the body shows that sellers dominated the markets. However, bulls step in driving prices up. But eventually, the bears won the battle in that particular session. The opposite is true about bullish Pin Bar candles.
Overview of support and resistance
Support and Resistance levels are simply ranges where the price seems to bounce off. The support forms when prices don’t seem to go lower than a certain range before bouncing back up. Resistance forms when prices don’t seem to rise beyond a certain range before falling again. For more about these levels, the Guide to Setting Up and Trading Using Support and Resistance on IQ Option will get you started.
Using Pin Bar candles alongside support and resistance
Once the price hits a support or resistance level, it’s very difficult to determine whether it will break out or reverse. However, an easy way to know that it will reverse is when a pin bar occurs at this level. Take a look at the image below.
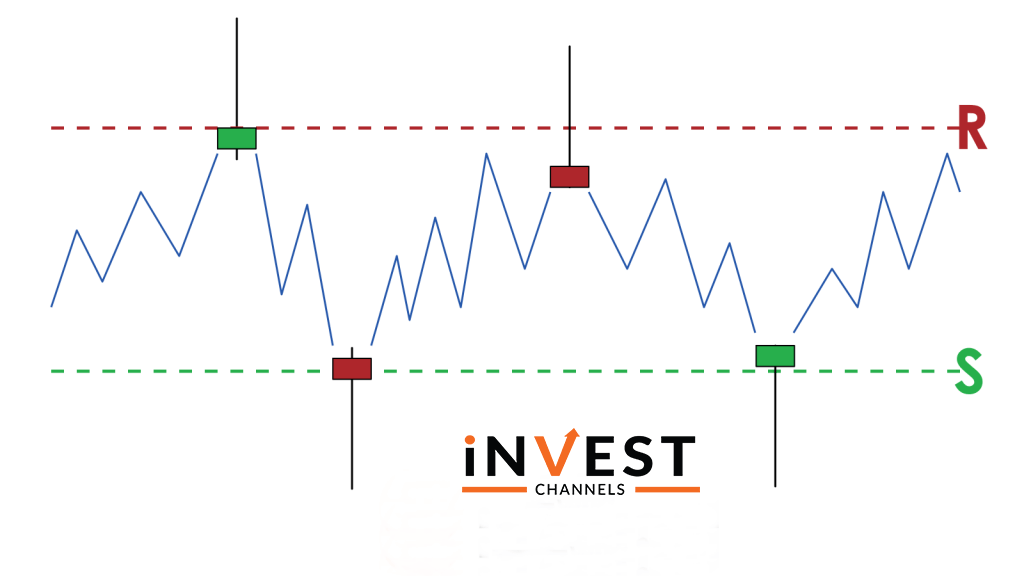
Once the prices touch the support or resistance range, two things can happen. The first is that the prices can break out of this level forming a new trend. The other is that the prices will reverse. A Pin Bar forms when buyers or sellers step in to prevent the prices from going further up or down. It takes a good eye to identify these instances which technical analysis proponents call a false breakout.
So when trading using Pin Bars alongside support and resistance, use the following rules:
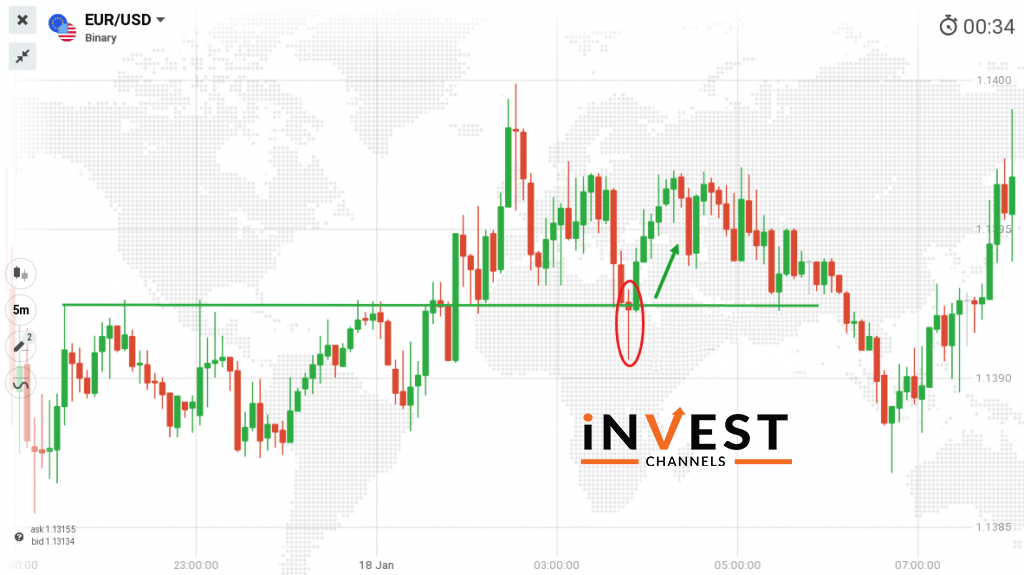
When the prices reach the support level and a bullish pin bar forms, enter a buy position.
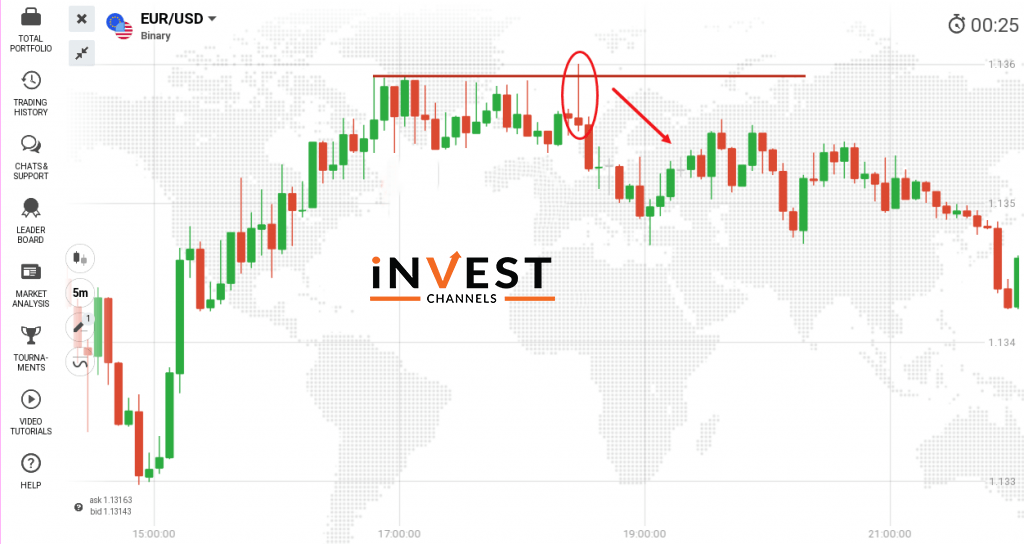
When prices reach the resistance level and a bearish pin bar forms, enter a sell position.
If you’re using a 5-minute candle interval chart, your trades should last 10 minutes or more.
Trading using Pin Bar candles with support and resistance on IQ Option
Enter into a sell position when the bearish pin bar reaches the resistance level
Enter into a buy position when pin bar forms on the support level
Now that you’ve learned how to trade using Pin Bar candles alongside support and resistance, try out this technique on your IQ Options practice account today. Share your results with us in the comments section below.
Good luck!
You might also want to read


Top 5 Trending
"Why do I keep losing money in trading?" This is a question every trader has asked at some point. Experiencing… [Read More]

Trading indices is more than just a financial pursuit; it's both an art and science, demanding attention to detail, a… [Read More]

Forget Tiffany’s—there’s a diamond that traders treasure even more. Diamond chart patterns may not sit on a ring, but they… [Read More]

The Psychological Line (PSY) Indicator is a versatile, oscillator-type trading tool that compares the number of periods with positive price… [Read More]

Have you ever felt like your trading approach could benefit from a little extra energy? That’s where the Relative Vigor… [Read More]