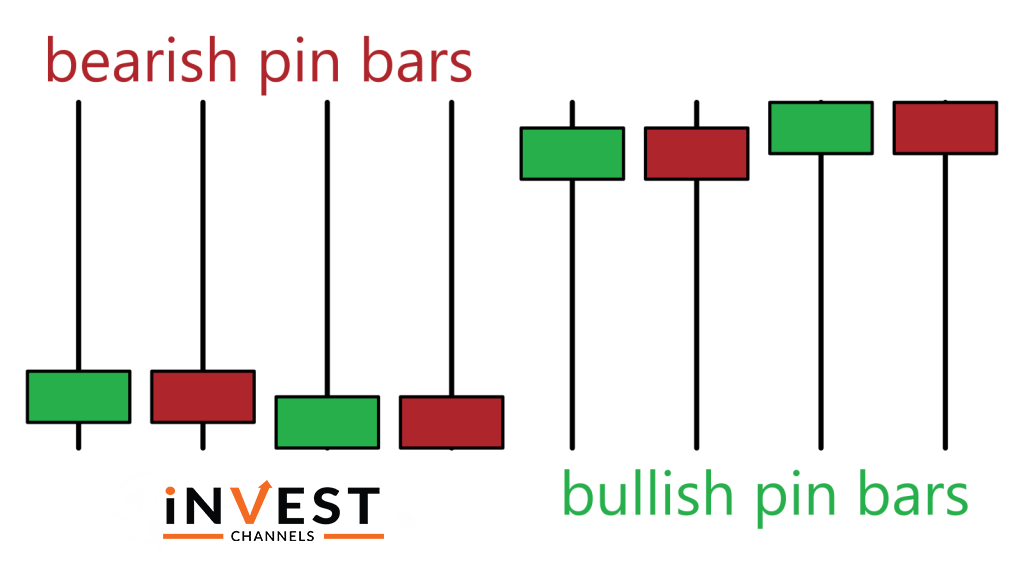
Pin bar candles are different types of Japanese candles which is easy to identify on your chart because of the distinct shape that makes it easy to identify on your chart.
Overview of the pin bar candle

Pin bars are small-bodied candles that have one long wick which is at least two thirds the overall length of the candle and a small wick at the opposite end of the candle body.
This special candle appears along with the trend and represents a sharp price reversal or rejection which enables you to expect to get bullish and bearish pin bar candles on your chart.
Bullish pin bars
This pin bar indicates the uptrend and in the case of downtrend this pin bar forms at the trend exhaustion point. At the top with a long downward-pointing shadow, the formation of this small body forms. This shows that bulls jumped in driving prices higher when the sellers pushed prices lower. So, when the candle forms, you should enter a buy position.
Bearish pin bars
This pin bar shows the downtrend and during an uptrend, at the trend exhaustion point, the bearish pin bar forms. At the bottom with a long upward-pointing shadow, this small body is formed.
The sellers jumped in and drove the prices lower when the buyers are trying to push prices higher. You should enter a sell position when the pin bar is completely developed.
Two ways to trade using pin bar candles on IQ Option
You need to ensure 2 conditions to meet to effectively trade using pin bar candles. First, wait for the pin bar to fully develop if the pin bar has a longer tail it will be better. And second, during trending markets, pin bars must form.

Trading using pin bar candles during trending markets
You should know that pin bar candles are a signal trend exhaustion and if a pin bar develops along with an uptrend then understand that the trend is about to reverse and vice versa. So if you are using1-minute interval candles, wait until a pin bar fully develops along with a trend and then enter a position in the reverse trend.
Note that if you’re using 1-minute interval candles, your trades should last about 5 minutes.
Trading pin bar candles based on their color
Notice that the bullish pin bars have an orange color and on the other hand, bearish pin bars are green in color. Now, how to trade pin bars using their colours.
Well, the answer is in the next candle that will form after the current pin bar. If the candle is bullish then the next candle will very likely be green in color and conversely, then the next candle will be orange in color if the current candle is bearish. So, in the case of a green color candle enter a buy position, and if an orange candle appears enter a sell position.
Now, it’s time to apply this knowledge to the practice account as you’ve learned about the pin bar candle and how to trade with it.
Good luck!
Top 5 Trending
In the world of online trading — often filled with risk and uncertainty — verifying the credibility of a platform… [Read More]
Starting your trading journey can feel overwhelming — there are countless assets to choose from, and it’s hard to know… [Read More]
"Why do I keep losing money in trading?" This is a question every trader has asked at some point. Experiencing… [Read More]
Trading indices is more than just a financial pursuit; it's both an art and science, demanding attention to detail, a… [Read More]
Forget Tiffany’s—there’s a diamond that traders treasure even more. Diamond chart patterns may not sit on a ring, but they… [Read More]


