There are many different ways to trade. Some traders will prefer to follow the trend. Others will trade according to the colour of the candles formed on the price chart. Many experienced traders will use Price Action Trading.
Price Action trading is commonly associated with the forex markets. However, it can be used to trade any market. This guide will look at what Price Action trading is.
Overview of Price Action
Price Action trading is a technique of trading where the trader reads the markets and makes their trading decision solely based on the actual asset price on the chart. Traders that use this technique believe that the asset’s price is the most important piece of data you need to make a trading decision. As such, many will avoid using indicators.
Why Price Action?
Followers of this discipline believe that there’s nothing new in the markets. History repeats itself. As such, prices will oscillate around a specific price point. With this knowledge, Price Action traders are able to make predictions about how the markets will act at certain periods.

Price Action traders will therefore keep looking for repeating price patterns on their charts. Their major question is, “What direction does the price take when it reaches a specific point?” Knowing the answer to this question allows the Price Action trader to make very accurate trading decisions in future trades.
One major advantage of Price Action trading is that you don’t need to rely on many indicators. Your only concern is the current price.
Trading using Price Action on IQ Option
Although many traders agree that Price Action trading doesn’t require the use of indicators (due to their lag), this trading technique works well when used alongside support and resistance lines.
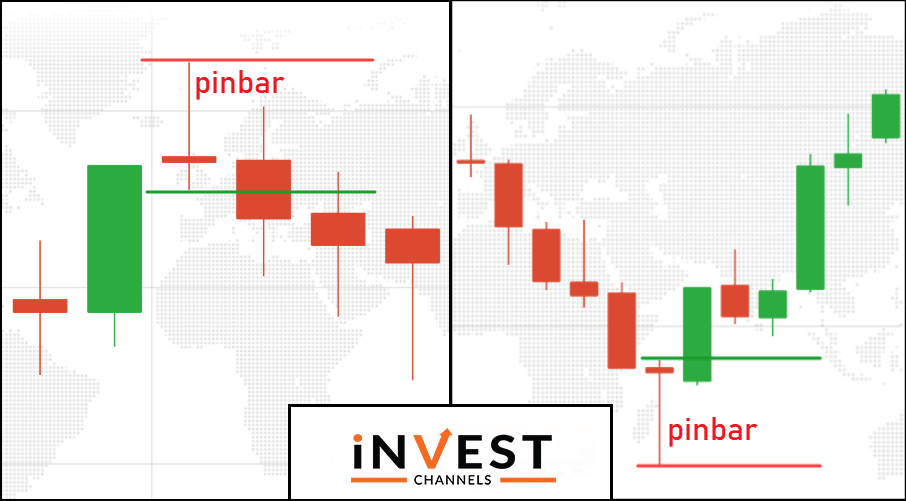
The reason for this is that prices tend to behave in a predictable way once they hit the support, resistance levels. Take a look at the snapshot below.

You will notice that once a pin bar candle develops along with the trend, it’s a signal for an impending trend reversal.
In the first image, the bearish pin bar develops signalling that prices are unlikely to rise beyond the high (tip of the upward-pointing shadow). In the second image, the bullish pin bar develops at the end of the downtrend signalling a trend reversal.
For a Price Action trader, prices aren’t likely to drop below the low of the pin bar (tip of the downward-pointing shadow). The Price Action trader’s trading strategy involves reading the charts this way.
What you need to trade using Price Action effectively
Becoming a Price Action trader is no easy feat. First, you’ll need to learn how to read price charts. This means knowing the different types of candles and what they signal.
Second, you’ll need to learn to identify price patterns. This will require a good grasp of how to draw support and resistance lines. Finally, you’ll need to instinctively know how prices react when they reach certain points along with the trend.
Verify your IQ Option account and make your first deposit
If you’ve already opened an IQ Option account, it’s advisable to verify it as soon as possible. Account verification has several advantages. One advantage is that your withdrawals will be processed faster. It also helps to keep your account more secure. IQ Option account verification takes roughly 5 working days.

Making your first IQ Option deposit is quite easy. The platform accepts several payment methods including debit/credit card and e-wallets such as Jeton Wallet, Neteller and Skrill. Depending on the payment method you choose, your deposit should reflect in your account within a few minutes.

Once you have deposited money in your account and had it verified, it’s time to start trading using real money.
Try out the Price Action trading strategy I’ve taught you today.

Once you’ve traded using the Price Action technique, I’d love to hear about your results in the comments section below.
Good luck!
Top 5 Trending
"Why do I keep losing money in trading?" This is a question every trader has asked at some point. Experiencing… [Read More]
Trading indices is more than just a financial pursuit; it's both an art and science, demanding attention to detail, a… [Read More]
Forget Tiffany’s—there’s a diamond that traders treasure even more. Diamond chart patterns may not sit on a ring, but they… [Read More]
The Psychological Line (PSY) Indicator is a versatile, oscillator-type trading tool that compares the number of periods with positive price… [Read More]
Have you ever felt like your trading approach could benefit from a little extra energy? That’s where the Relative Vigor… [Read More]


