The Psychological Line (PSY) Indicator is a versatile, oscillator-type trading tool that compares the number of periods with positive price movement against the total number of periods analyzed.
Essentially, this indicator reveals the percentage of bars closing above the previous bar within a selected timeframe, helping traders gauge the market’s general trend—bullish or bearish—and pinpoint overbought or oversold levels.
This guide covers how to effectively use the Psychological Line Indicator to obtain clearer trading signals, making it an essential addition to your technical analysis toolkit.
Understanding How the Psychological Line Indicator Works
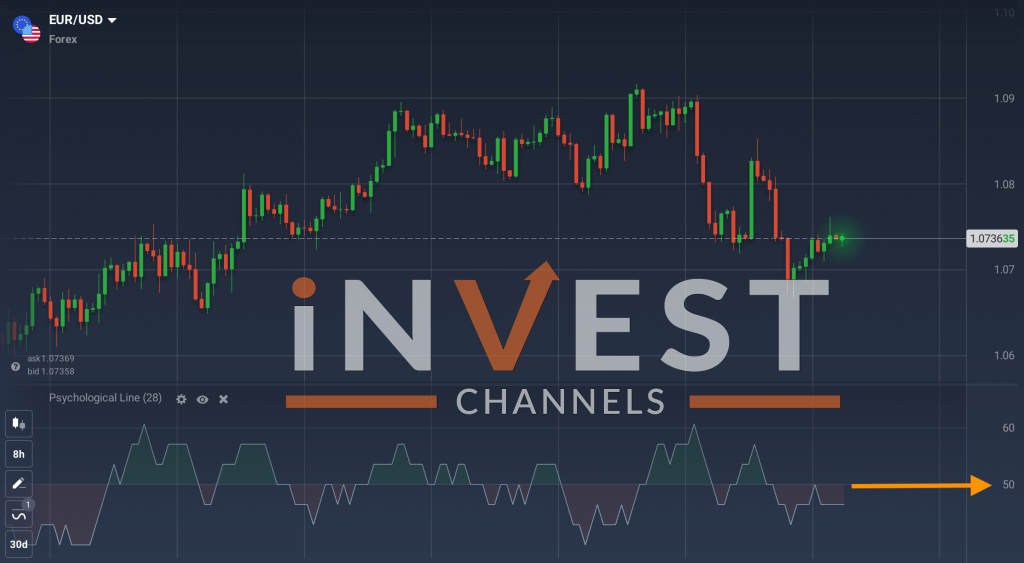
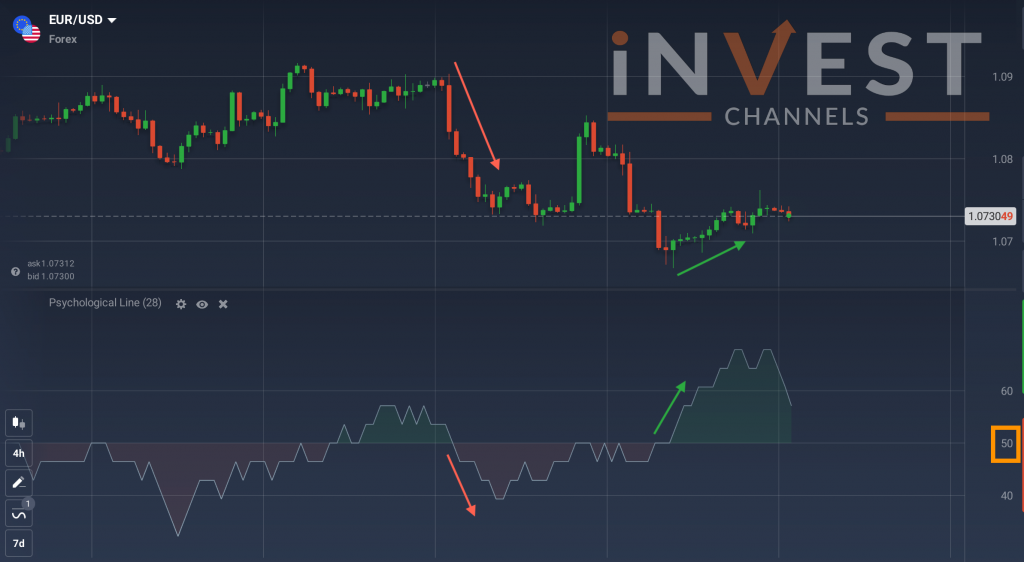
Simple to configure and interpret, the PSY Indicator’s line oscillates between 0 and 100, allowing it to adapt to any timeframe, whether daily, weekly, or monthly, and apply to any asset class. When the indicator reads above 50, buyers are in control, indicating a bullish sentiment. If the indicator falls below 50, sellers dominate, suggesting a bearish sentiment.

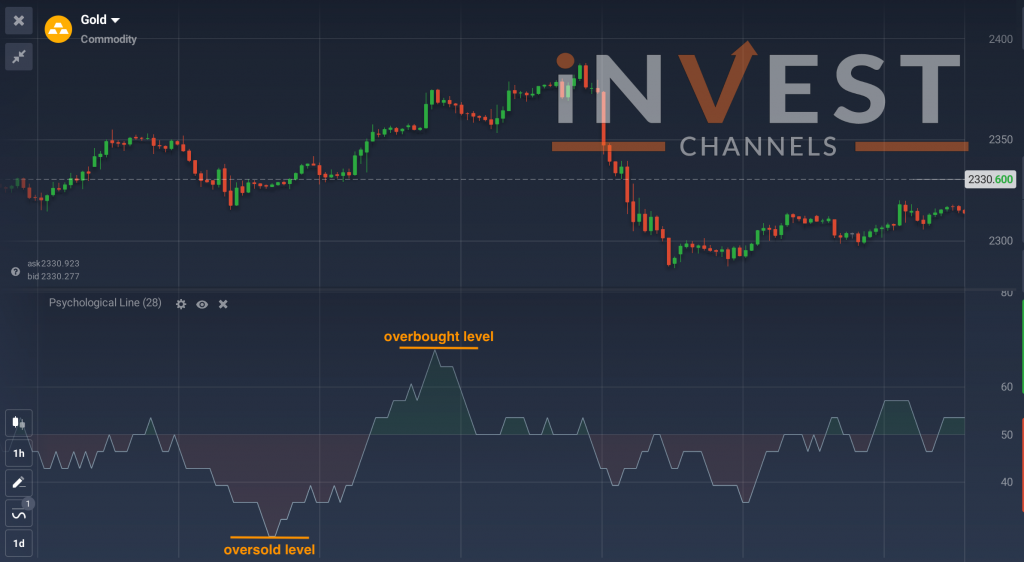
This indicator also identifies overbought and oversold levels, similar to other oscillators. When the line moves above 70, the asset is seen as overbought, suggesting a likely reversal to a negative trend. Conversely, when it falls below 30, the asset is considered oversold, signaling the potential for a future upward trend.

The closer the line approaches 100, the stronger the positive market momentum. Conversely, a reading closer to 0 indicates a strengthening negative trend. By observing these levels, traders gain insights into the overall market sentiment and can make quicker, data-informed decisions.

Trading Strategies with the PSY Indicator
The Psychological Line Indicator is highly versatile, offering unique trading signals and serving as an excellent tool to confirm readings from other indicators. Even when used as a primary indicator, it’s prudent to cross-check its signals with complementary indicators for a more reliable market analysis.
Here are some of the most common trading strategies when using the Psychological Line Indicator:
1. Trading with the Trend
One popular approach is trading along with the market’s prevailing trend. For instance, if the PSY indicator is above 50 (in the bullish, or “green” zone), this signifies a strong buyer presence.
Many traders see this as an opportunity to open a buy position. Conversely, when the indicator dips below 50 (into the bearish, or “red” zone), it suggests that sellers are dominant, making a sell position more favorable.

2. Identifying Trend Reversals
The PSY Indicator’s overbought and oversold levels (typically set at 70 and 30) are helpful for spotting potential trend reversals. When the PSY line crosses above the 70 level, it implies that the asset is in an overbought condition and may soon reverse downward as it is unlikely to stay overbought indefinitely.
Similarly, if the indicator moves below 30, it signifies an oversold asset, hinting at a potential upward reversal.

However, the Psychological Line Indicator does not predict the exact moment of a reversal, so additional indicators and market experience are essential for identifying when a trend might actually reverse.
3. Recognizing Divergence
As with other oscillators, the PSY Indicator can signal divergences—situations where the indicator line moves in the opposite direction to the asset’s price movement.
Divergence often suggests that a trend reversal is imminent. For instance, if the price is rising but the PSY line is decreasing, it may indicate that the bullish momentum is waning, and a downtrend could soon follow.

It’s essential to remember that, like any trading tool, the Psychological Line Indicator is not infallible and may occasionally provide false signals. Incorporating sound risk management strategies is crucial to limit potential losses and protect your capital while using this indicator.
Configuring the Psychological Line Indicator
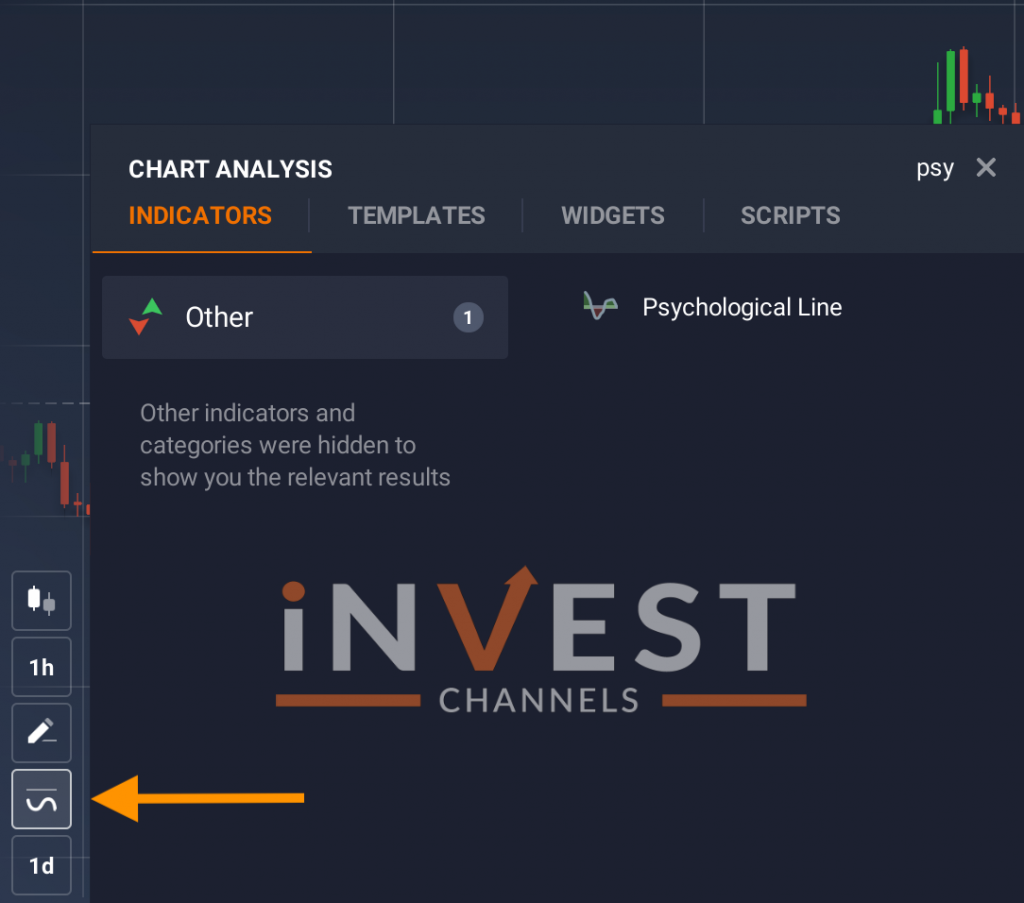
Setting up the Psychological Line Indicator is straightforward. To add it, navigate to the “Indicators” option, usually located in the bottom left of most trading platforms. Then, go to the “Other” tab and select “Psychological Line” from the list or simply search for it by name.

Once selected, apply the indicator using its default settings. These settings typically use a preset number of periods, which you can adjust according to your trading preferences.
Generally, extending the period reduces the indicator’s sensitivity to market fluctuations, providing a smoother line but fewer signals. Conversely, reducing the period heightens sensitivity, which can help capture shorter-term price movements but may also increase the likelihood of false signals.
Practical Tips for Trading with the Psychological Line Indicator
- Use with Complementary Indicators: While the Psychological Line Indicator is valuable, using it alongside other indicators like Moving Averages or RSI (Relative Strength Index) can help validate its readings and reduce the impact of false signals.
- Consider Different Timeframes: The indicator is flexible enough for multiple timeframes, but it may yield different signals on a daily chart compared to an hourly chart. Make sure the selected timeframe aligns with your trading goals and strategies.
- Adjust Based on Asset Volatility: In highly volatile markets, consider using a longer period setting on the indicator to avoid excessive noise, especially for assets that are prone to frequent, unpredictable price swings.
- Monitor Overbought and Oversold Levels: Levels above 70 or below 30 do not guarantee an immediate reversal, but they serve as useful markers to watch for potential shifts. Cross-check with other technical indicators or price patterns to confirm these signals.
- Practice Patience and Discipline: Reacting too quickly to each signal can result in overtrading and increased losses. Focus on higher-probability signals that align with broader market trends and your overall trading plan.
Getting Started with the PSY Indicator
After configuring the indicator on your preferred trading platform, you’re ready to test it in real market conditions. The Psychological Line Indicator has the potential to become an invaluable component of your trading strategy, enhancing your technical analysis capabilities and helping you make more informed decisions.
However, keep in mind that, like all indicators, it has limitations and should be used as part of a broader strategy rather than as a standalone tool.
Experiment with the PSY Indicator on demo accounts first to understand how it behaves across different timeframes and market conditions. Over time, you may find it becomes an essential tool in your trading approach, or at the very least, it will broaden your analytical skills.
Good luck, and happy trading!
Top 5 Trending
In the world of online trading — often filled with risk and uncertainty — verifying the credibility of a platform… [Read More]
Starting your trading journey can feel overwhelming — there are countless assets to choose from, and it’s hard to know… [Read More]
"Why do I keep losing money in trading?" This is a question every trader has asked at some point. Experiencing… [Read More]
Trading indices is more than just a financial pursuit; it's both an art and science, demanding attention to detail, a… [Read More]
Forget Tiffany’s—there’s a diamond that traders treasure even more. Diamond chart patterns may not sit on a ring, but they… [Read More]


