
Understanding the RSI indicator
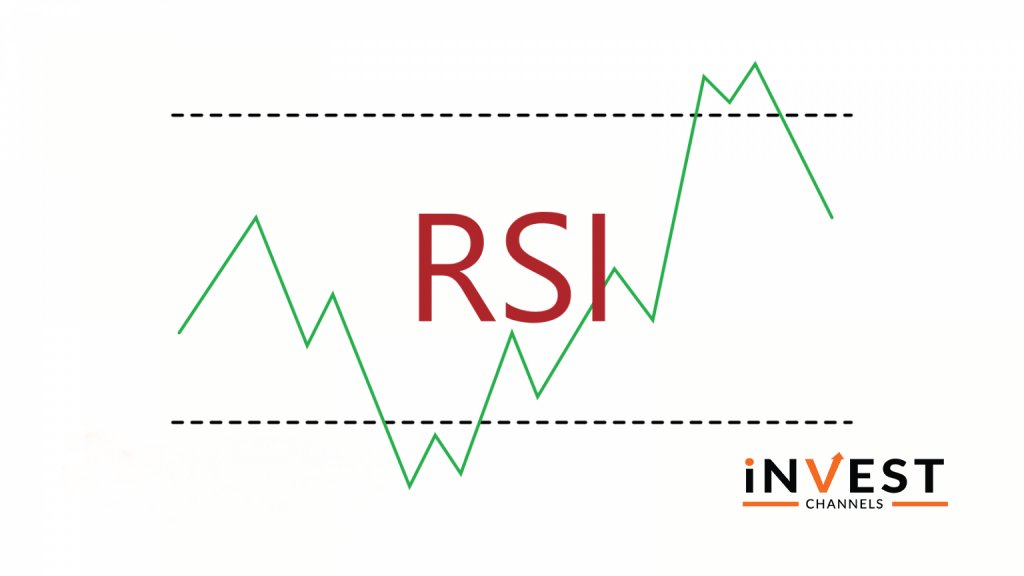
The Relative Strength Index (RSI) is a momentum oscillator that measures how fast price changes are occurring with regard to an underlying instrument. It’s used for technical analysis to identify when an underlying asset is oversold or overbought therefore signalling an impending trend reversal. In the IQ Option platform, you can use the RSI to determine the tops and bottoms of a trend.
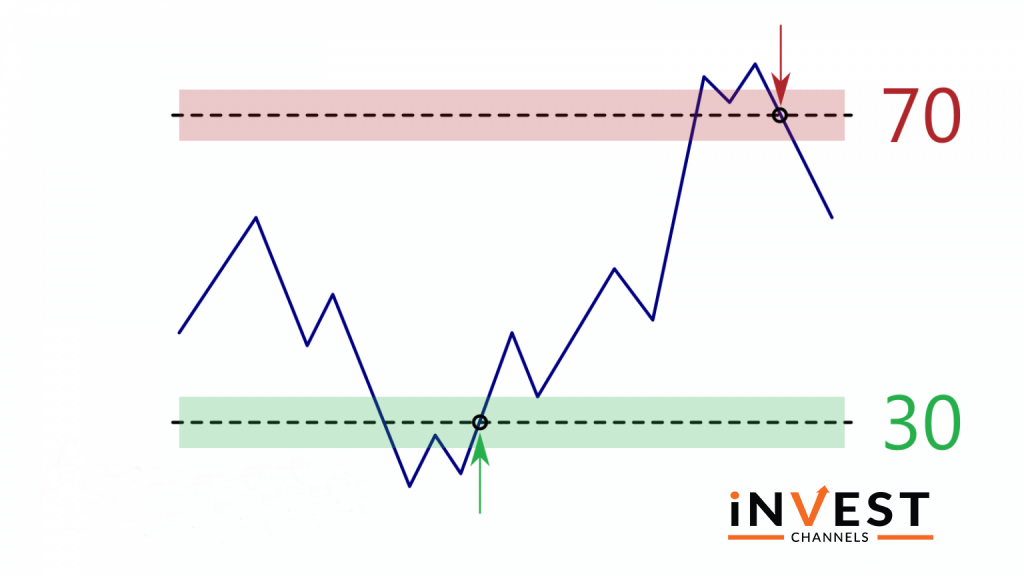
The RSI indicator consists of two extremes 0 and 100. Between these are two lines at the 70 and 30 mark. The RSI will oscillate between 0 and 100. However, the two parallel lines (70 and 30) are what you must focus on. If the RSI rises above 70, the underlying instrument is considered overbought. Conversely, when the RSI crosses below 30, the instrument is considered oversold.
When the asset is said to be oversold, it means that sellers are dominating the market. On the other hand, if it’s overbought, buyers are dominating the market making prices rise sharply.
Setting up RSI on your IQ Option account
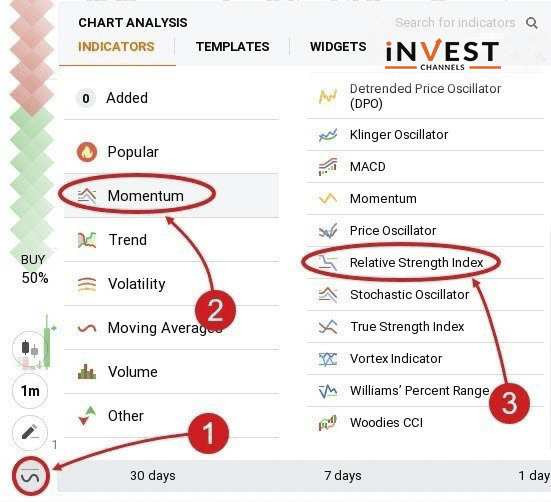
First, click on the indicators feature at the bottom of your chart. Next, click on momentum indicators and from the list, select Relative Strength Index.
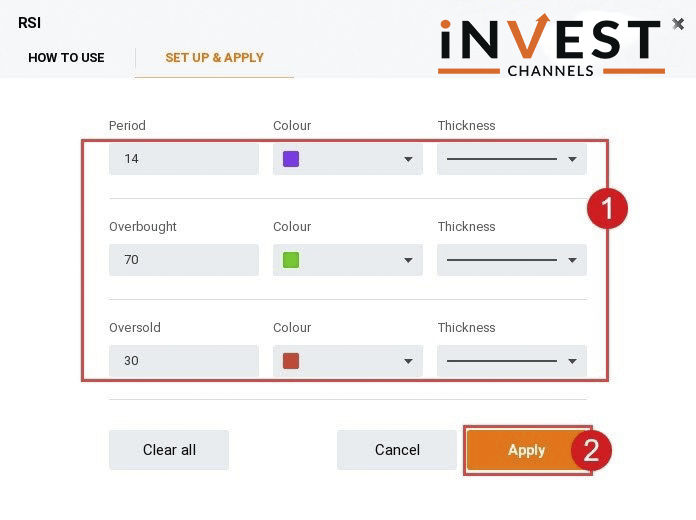
On the settings panel, you’ll come across three elements. The period is simply the time frame the RSI is measuring. In this case, 14 means RSI is measuring price changes in an asset over 14 candles. The overbought and oversold lines have been explained previously. Once you’ve made the settings, click on apply to save them.
Using RSI to trade profitably on IQ Option
The RSI oscillates between the 0 and 100 marks. If it goes beyond the 70 mark, it’s considered overbought meaning it’s just a matter of time before price movement reverses. If it goes below the 30 mark, it’s considered that the asset is overbought and prices are bound to reverse and start rising in the near future.
So how can you use this information to make some profit?
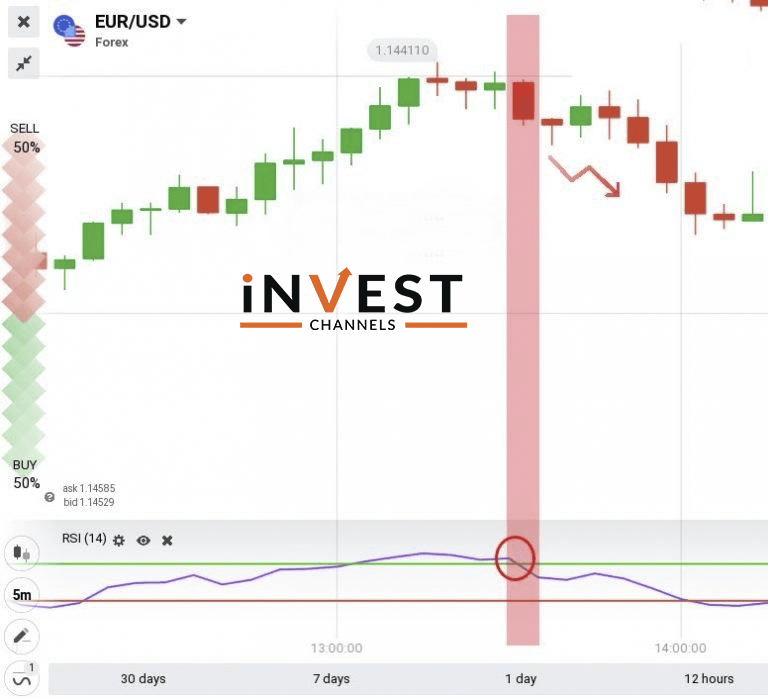
When RSI crosses the 70 mark
As prices keep rising in an uptrend, the RSI will cross the 70 mark. This signals that buyers are dominant and the uptrend is likely to continue for a while. At this price point enter a short buy trade. Eventually, the prices are bound to reverse and start falling. Just as the RSI crosses the 70 mark, you should enter a sell trade. You should expect the downtrend to continue for a while.
When RSI crosses the 30 mark
If there’s a downtrend and prices approach the 30 mark from above, wait until the price crosses the 30. Then place a sell order. You expect the prices to remain below 30 for a while due to the dominant nature of sellers. Once the downtrend is exhausted and starts reversing, wait until the RSI crosses 30 from below. Then place a buy order.
These are classic trend-following techniques where you trade along the trend. RSI simply gives you clues about where it’s best to enter a trade using overbought and oversold signals.
Understanding RSI divergence for better trading on IQ Option
Traditionally, you’ll use RSI to identify overbought and oversold conditions. In addition, you should expect the RSI to move along with price movements. But this isn’t always the case.
RSI divergence is a common occurrence in every market. It occurs when rather than the RSI dropping along with the price in a downtrend, it starts rising. On the other hand, you’ll notice the RSI starting to drop when the prices are clearly rising in an uptrend.
RSI divergence is a signal of an impending trend reversal. In fact, RSI divergence can be used with 80% accuracy to predict a trend reversal.
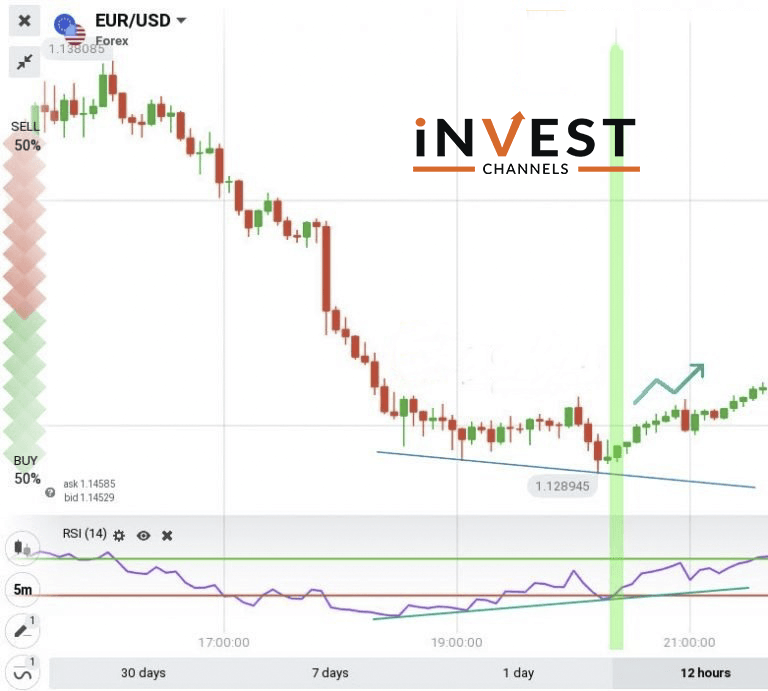
Look at the snapshot below: The trend starts as an uptrend before reversing with the RSI crossing below 30. You would expect the trend to remain under 30 for a while. But instead, it reverses creating a strong uptrend. How would you have predicted the uptrend?
Look at the downtrend in the chart. A true downtrend has lower highs and lower lows. But in our case, you will find that there are higher lows and some higher highs. This means that buyers are flexing their muscles. It’s a sign that the uptrend is imminent.
Now that you know how RSI works, I recommend you now open an IQ Option demo account and try trading using it yourself.
The best of luck!
You might also want to read

Top 5 Trending

"Why do I keep losing money in trading?" This is a question every trader has asked at some point. Experiencing… [Read More]
Trading indices is more than just a financial pursuit; it's both an art and science, demanding attention to detail, a… [Read More]

Forget Tiffany’s—there’s a diamond that traders treasure even more. Diamond chart patterns may not sit on a ring, but they… [Read More]
The Psychological Line (PSY) Indicator is a versatile, oscillator-type trading tool that compares the number of periods with positive price… [Read More]
Have you ever felt like your trading approach could benefit from a little extra energy? That’s where the Relative Vigor… [Read More]