

Support and resistance are a good way to identify the prices at which a trend is likely to reverse. But, they cannot effectively help you determine the direction the price will take. That’s why it’s best to use support/resistance alongside another indicator. In this guide, we’ll use the Relative Strength Index (RSI) in conjunction with the support/resistance.
RSI is a momentum indicator that measures the strength of recent price changes showing overbought and oversold conditions of the underlying financial instrument.
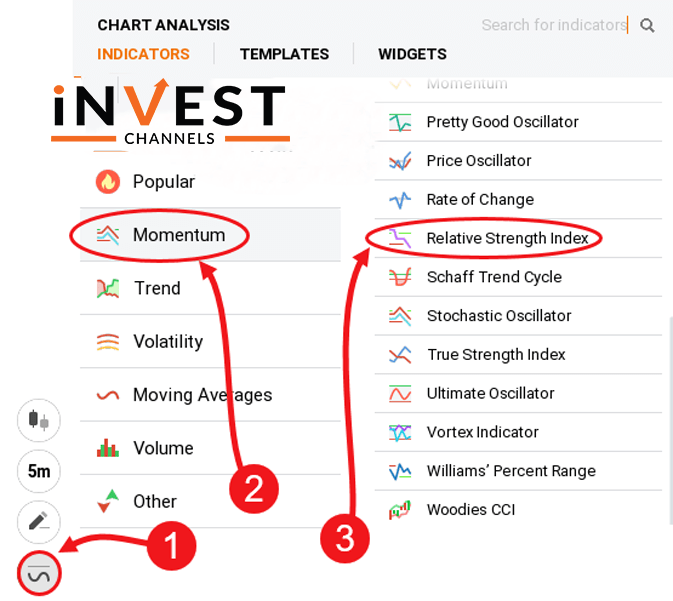
Setting up the RSI indicator on your IQ Option account
Go to the “indicators” feature on the left of your trading interface. Next, select momentum and finally choose Relative Strength Index.
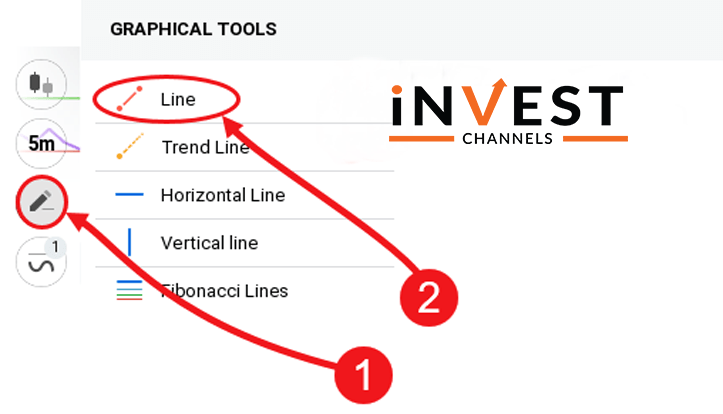
Setting up support and resistance on your IQ Option account
Since there isn’t a specific indicator called support/resistance, you should create one yourself by using a line tool. Click on the graphical tools feature and then select line. To create the support, click on a low price point and drag the line connecting other low price points on the chart. To create the resistance, repeat the process of selecting the line tool. Then, click on a high price point. Hold the mouse button and drag the cursor drawing a horizontal line that connects the high price with other high price points on your chart.
RSI and support/resistance are ideal for longer trades
RSI stands for Relative Strength Index. This measures the relative strength of a specific financial instrument. RSI has value. For example, 14 RSI means the relative strength index of 14 consecutive candles.
Another concept you should understand is RSI divergence. This measures the price of an asset against its relative strength index. For example, when an asset’s price rises, its relative strength index falls and vice versa. This essentially signals that the price trend will soon reverse.
Support and resistance are useful technical analysis tools. When applied, they will give you an idea about where the prices are likely to reach before a reversal occurs. When combined with RSI, they will give you an idea about an impending trend reversal.
How to use RSI and support/resistance to trade long positions on IQ Option
Start by setting up a 5-minute candles chart for the EUR/USD pair on your account. I prefer 5-minute candles because they offer a better picture of how the markets are moving compared to smaller time frames like 1 minute or 30 seconds. Larger candles are also harder to read especially since we’re going to place 15 to 30-minute trades.
Once your chart is open, set up your RSI indicator.

Analyze your chart and identify support/resistance level
Using the chart below, I identified a support level where prices hit a low range and bounced back. I expected the prices to rise once more if they hit this level again.
Enter into a long position with a trade lasting 15 to 30 minutes
The prices eventually fell back to the support level I had identified. The RSI was rising creating a divergence (view chart). This indicated an uptrend was imminent so I went long.
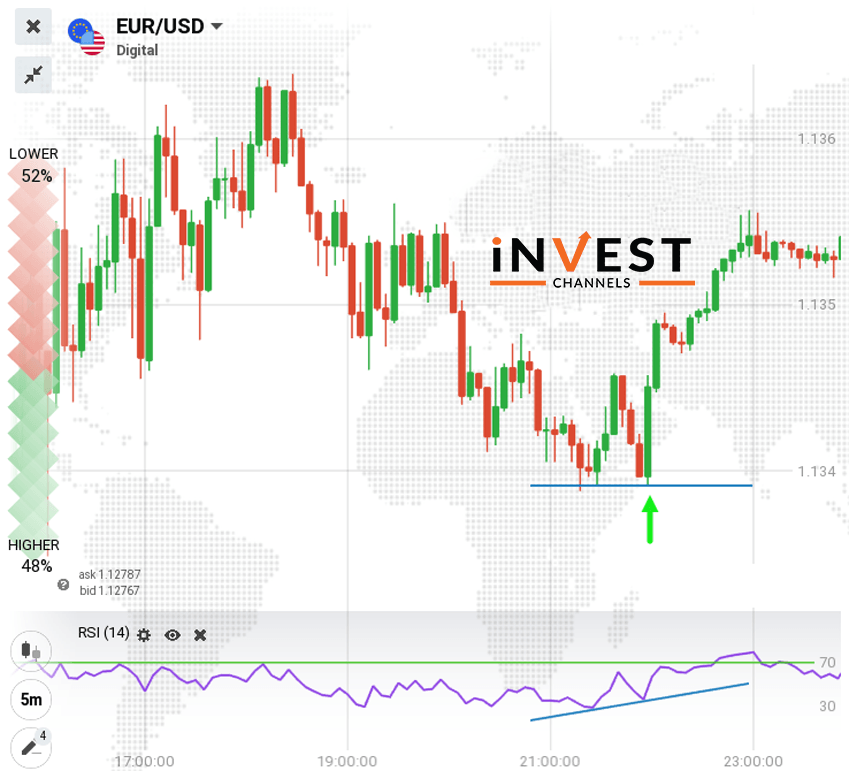
It takes some bit of practice to follow these steps, especially identifying the appropriate support/resistance level. That’s why I recommend using the 5-minute candles because they make it easy to identify new support/resistance levels as they come up. In my chart, coincidentally the RSI divergence occurred right where I had placed my support line. The price continued to increase allowing me to profit from my long position.
If you find this a bit overwhelming, I suggest you try it out on an IQ Option demo account. With time, you’ll find that it’s easier than it sounds.
Enter long sell position with a trade lasting 15 to 30 minutes
The price finally rebounded to the previous resistance level. Looking at the RSI, it was also falling creating a divergence. This was an indicator to enter a sell position. So I placed a sell trade lasting 15 minutes. Interestingly, the downtrend continued for quite some time.
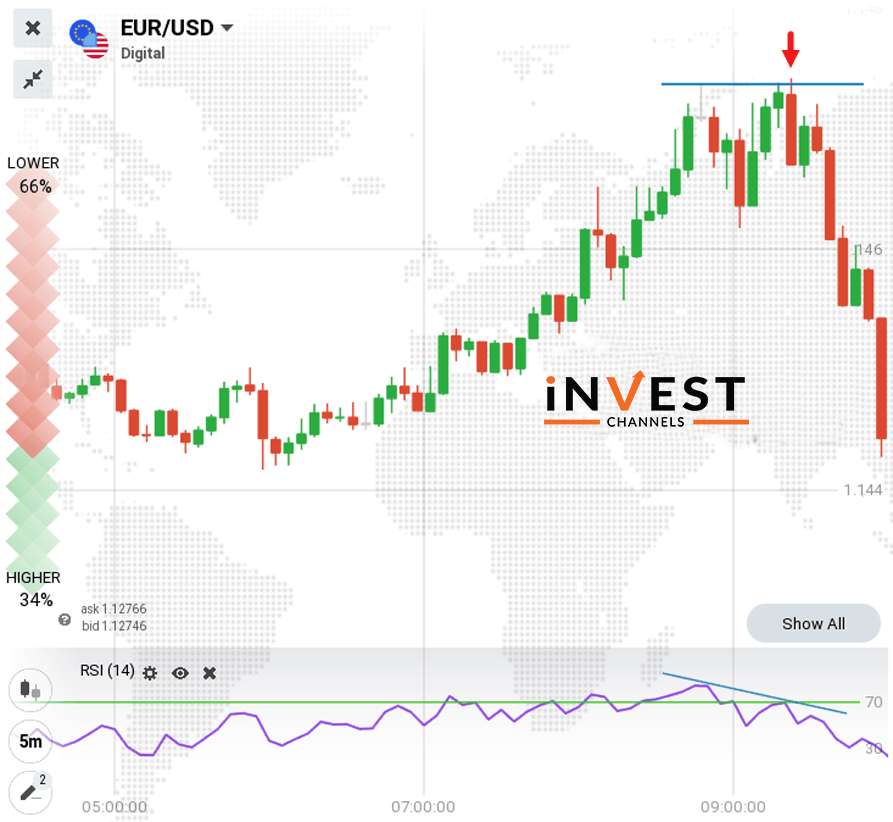
When using RSI you shouldn’t worry too much about the price touching the resistance/support level. Simply observe whether the RSI indicator is falling or rising when the price hits the resistance/support. If it’s rising, there’s an impending uptrend. If dropping, there’s an impending downtrend.
Have you used RSI alongside support/resistance? How did these two indicators work for you? Give us your views in the comments section below.
Good luck!
You might also want to read


Top 5 Trending
In the world of online trading — often filled with risk and uncertainty — verifying the credibility of a platform… [Read More]

Starting your trading journey can feel overwhelming — there are countless assets to choose from, and it’s hard to know… [Read More]

"Why do I keep losing money in trading?" This is a question every trader has asked at some point. Experiencing… [Read More]
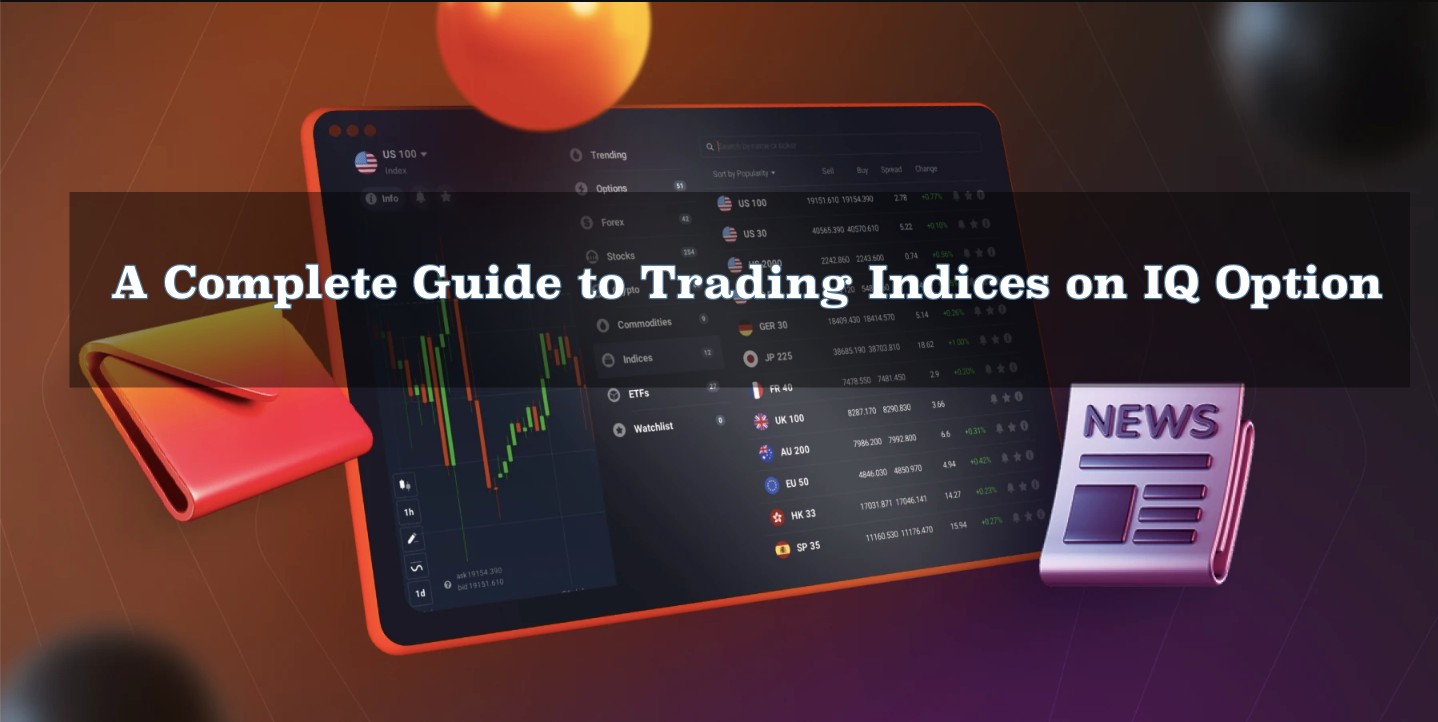
Trading indices is more than just a financial pursuit; it's both an art and science, demanding attention to detail, a… [Read More]

Forget Tiffany’s—there’s a diamond that traders treasure even more. Diamond chart patterns may not sit on a ring, but they… [Read More]