The Simple Moving Average (SMA) is a moving average indicator that’s calculated by adding the recent closing prices and dividing the result by the number of time periods covered by these prices. This indicator is used to determine whether the price will continue moving in the current trend or reverse.
This guide will teach you how to set up the SMA on IQ Option and use it to trade.
Setting up the SMA indicator on IQ Option
The SMA indicator can be used in all charts offered by IQ Option. However, I recommend using this indicator on the Japanese Candles chart. The reason for this is that the candles chart is easy to read especially when used with the SMA.
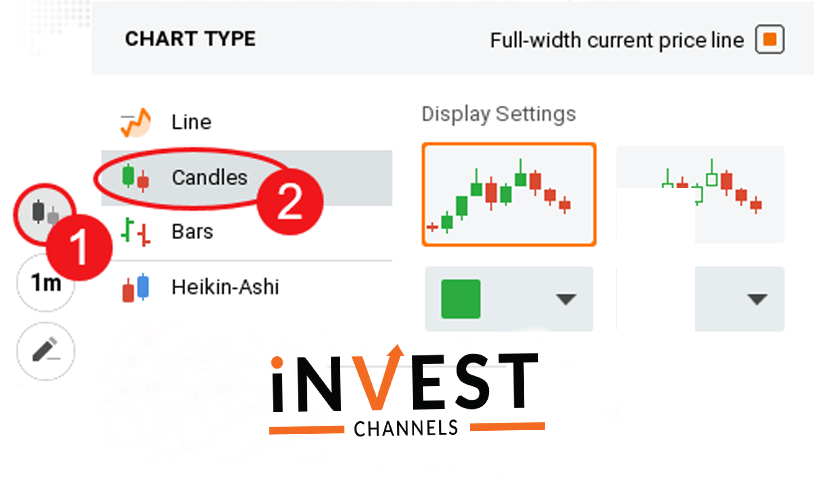
Start by setting up the Japanese candles chart on your IQ Option trading account. Click on the charts feature on your trading interface and then select candles.

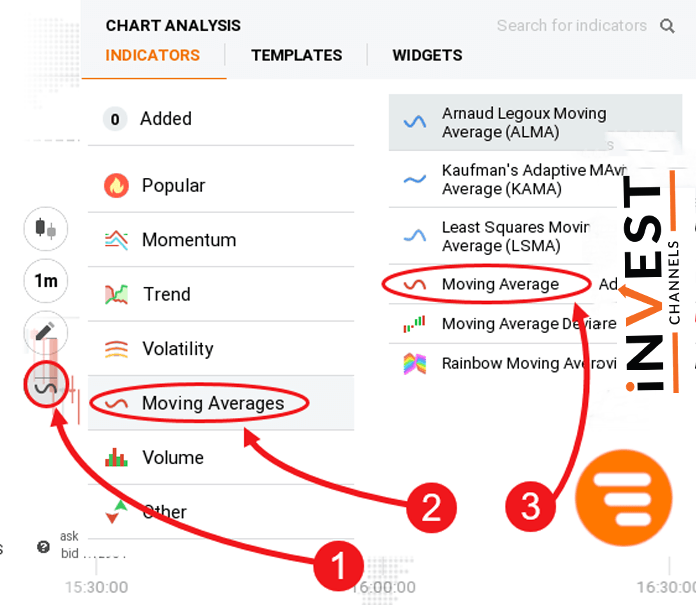
Next, click on the indicators feature on your trading interface. Select Moving Averages and finally click the Moving Average option.
On the moving average window, select SMA as type and set the period to 10.

Your Japanese candles chart should have 1-minute interval candles. This makes it easy to analyze the price and SMA movements and enter trades lasting 1 minute or more.
Trading with SMA on IQ Option

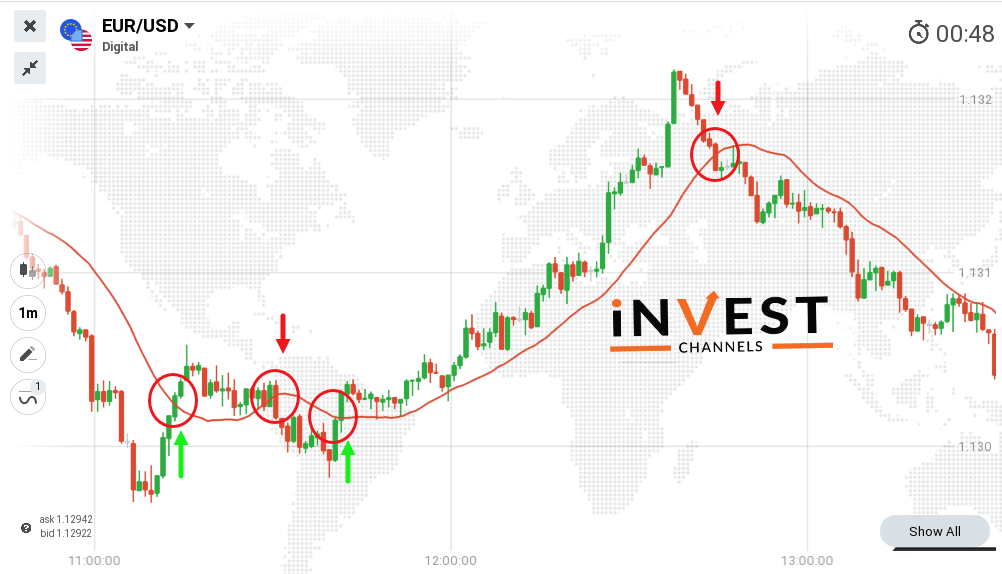
How do you enter trades using the SMA10 indicator on IQ Option? Let’s use the chart above to determine your trade entries.
If the SMA10 cuts the price from above and starts moving below it, you should enter a buy position. Note that the SMA10 must cut the prices on a bullish candle signalling an uptrend. Since the chart has 1-minute interval candles, your buy position should last anywhere between 1 and 5 minutes. Your trade entry should be at the close of the bullish candle that the SMA10 cuts through.
If the SMA10 cuts the price from below and starts moving above it, you should enter a sell position. The SMA should cut through a bearish candle. The close of this bearish candle should be your trade entry point and you should hold the position for 1 or more minutes.
Tips for using SMA for trading
SMA might help you to identify potential trend reversal points on your chart. However, this indicator experiences a lag. It’s therefore not very accurate at predicting any future price movements. Fortunately, you can use it alongside other technical indicators such as the Parabolic SAR and the RSI.
Set the SMA period depending on your trading preferences. For example, if you prefer entering short positions (not lasting over 10 minutes) your SMA period should be 10. For long positions, increase the period value appropriately. However, the higher the period value, the larger the lag experienced.
SMA works very well in volatile markets. So if you anticipate that a news item is likely to affect your trading instrument, set up the SMA and use it to trade trend reversals.
As you’ve seen, the SMA indicator is simple to set up and use on the IQ Option platform. Try it out today on your practice account. We’d love to hear your views about this indicator in the comments section below.
Good luck!
Top 5 Trending
"Why do I keep losing money in trading?" This is a question every trader has asked at some point. Experiencing… [Read More]
Trading indices is more than just a financial pursuit; it's both an art and science, demanding attention to detail, a… [Read More]
Forget Tiffany’s—there’s a diamond that traders treasure even more. Diamond chart patterns may not sit on a ring, but they… [Read More]
The Psychological Line (PSY) Indicator is a versatile, oscillator-type trading tool that compares the number of periods with positive price… [Read More]
Have you ever felt like your trading approach could benefit from a little extra energy? That’s where the Relative Vigor… [Read More]


