

I always discourage traders from taking short positions even if trading options. For example, if you enter a 1-minute trade, a 2-second price fluctuation can result in a losing trade.
But what if the trade was to last 5 minutes, or even 30 minutes? It’s implausible that the 2 second or even 10-second fluctuation would have changed the trade much. Another reason why I discourage holding a position over a short time frame is it’s harder to analyze the markets over a short amount of time and make a good trading decision.
With that out of the way, holding the position for longer time intervals doesn’t guarantee that all your trades will be winners. But you’ve increased the probability of getting more winners just by holding positions longer.
Now let’s increase this probability further by introducing a set of technical analysis tools; the Simple Moving Average (SMA) and the support and resistance levels.
Setting up SMA indicator on IQ Option
SMA is a trend following indicator. This indicator is formed by calculating the average price of the underlying instrument over a predefined number of time intervals. It’s worth noting that the SMA doesn’t predict the direction of the trend. This is because it has a lag due to the fact that the average prices are calculated from previous prices.
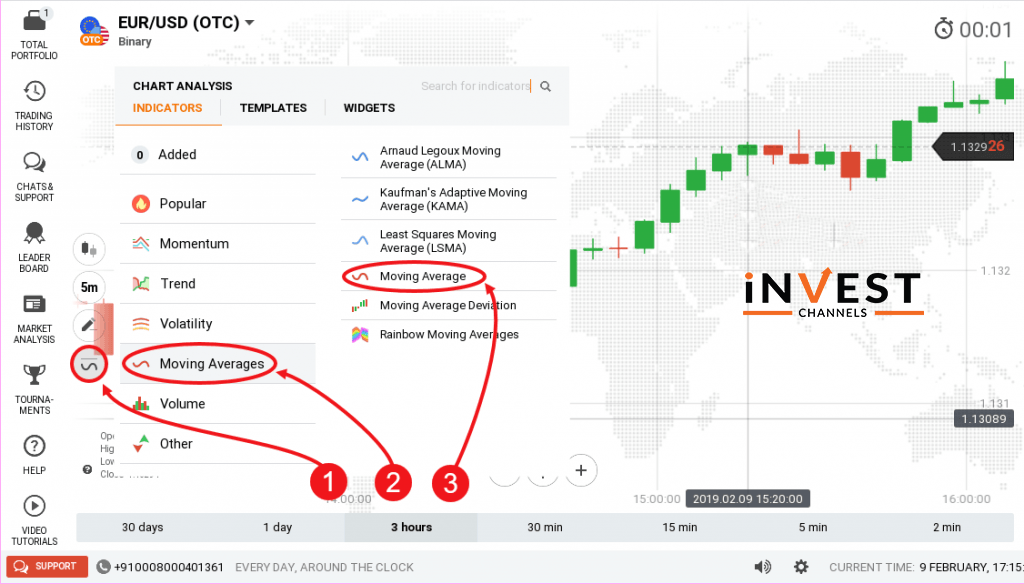
To set up this indicator, log into your trading account and set up your chart. Next, click on the indicators feature and select moving averages. Finally select moving average.
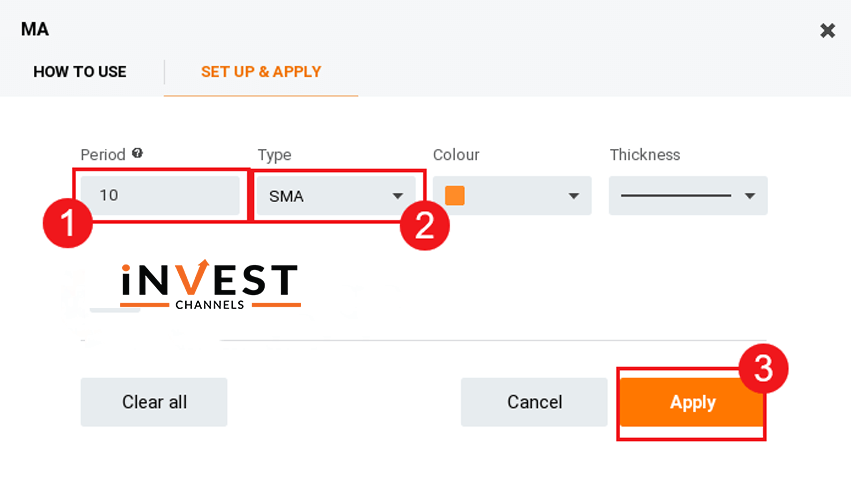
In our trading example, I’ll use the SMA10 and SMA30 indicators. To set up the SMA30, repeat the steps above. The only changes you’ll make is the period changing it to 30 and the colour-changing it to blue.
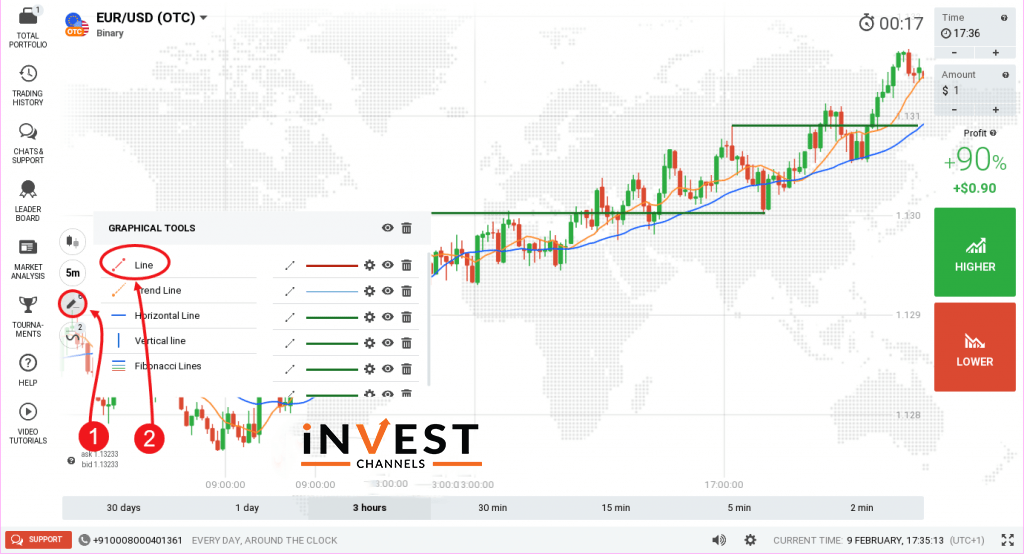
With your SMA indicators set, the next thing you’ll need is to create the support and resistance lines. To do this, click on the graphical tools feature (right below the indicators feature). Select line.
How SMA10 and SMA30 work alongside support and resistance
When the SMA10 (orange) cuts across the SMA30 (blue) from below and moves above it and the gap between both starts to widen, an uptrend is developing.
When the SMA10 cuts the SMA30 from above and moves below it and the gap between both starts widening, a downtrend is developing.
If both SMA10 and SMA30 keep intersecting each other and the gap between them remains narrow, the markets are ranging.
But this alone isn’t enough to know when to enter a long position. You’ll need to employ the use of support and resistance. Only open a long position when both SMA10 and SMA30 cross the support or resistance line and the gap between them is widening.
Trading using SMA10 and SMA30 alongside support and resistance on IQ Option
The first thing to remember is you want to trade with larger time intervals. So avoid using 1-minute candles. I recommend 5-minute candles. This way, you will be able to open positions lasting 30 minutes or more.
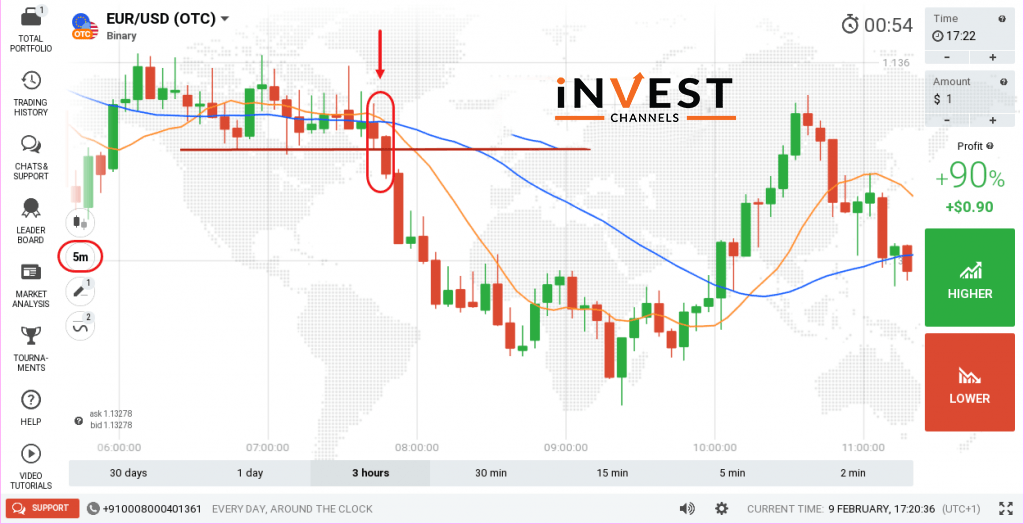
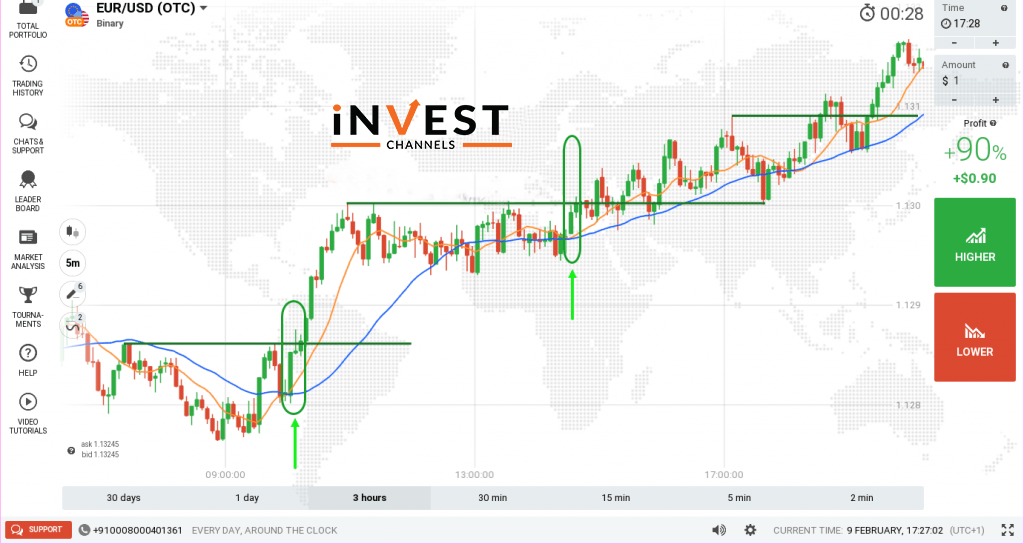
Entering a long sell position
From the image below, the prices break the support line and start falling. In addition, the SMA10 has cut the SMA30 from above and is moving below it. The gap between both starts widening. At this point enter a long sell position. Since each candle has a 5-minute interval, you can open a long sell position lasting 30 minutes or more.
Entering a long buy position
In the image below there are 3 resistance levels. The trend is going up. Once the price breaks the resistance level, you’ll notice that the SMA10 cuts the SMA30 from below moving above it. In addition, the gap between them widens. This is a signal to enter a long buy position of 30 minutes or more.
Conclusion
SMA10 and SMA30 can be used together to predict an upcoming trend. They simply intersect each other and the gap between them starts widening. However, if you add support and resistance levels, you can be sure that the trend has finally developed and it’s time to enter a long position.
Now that you’ve learned how the SMA and support/resistance work when trading long positions, try it out in your IQ Options practice account. I’d love to hear your results in the comments section below.
Good luck!
You might also want to read


Top 5 Trending

"Why do I keep losing money in trading?" This is a question every trader has asked at some point. Experiencing… [Read More]
Trading indices is more than just a financial pursuit; it's both an art and science, demanding attention to detail, a… [Read More]
Forget Tiffany’s—there’s a diamond that traders treasure even more. Diamond chart patterns may not sit on a ring, but they… [Read More]
The Psychological Line (PSY) Indicator is a versatile, oscillator-type trading tool that compares the number of periods with positive price… [Read More]
Have you ever felt like your trading approach could benefit from a little extra energy? That’s where the Relative Vigor… [Read More]