In the high-stakes world of binary options trading, having the right indicators on hand can be the difference between a profitable day and a missed opportunity. For traders operating on short timeframes, here’s a look at the top indicators to rely on to spot trend changes and execute informed trades.
- Moving Averages (MA)
Moving Averages are one of the simplest yet effective indicators for binary options trading, designed to smooth out price fluctuations and reveal the trend’s direction. For binary options, short-term MAs are typically used, with traders often favoring periods of 5, 10, or 25.
Identifying Trends with MAs:
- Bullish Trend: If the price is above the MA line, it’s a sign of a bullish trend.
- Bearish Trend: If it’s below, this signals a bearish trend.
Golden Cross / Death Cross Strategy
Using two MAs together can enhance the strategy — known as the Golden Cross or Death Cross. Here’s how to apply it:
- Set up two SMAs, one with a period of 5 and another of 15.
- Golden Cross: When the short-term MA (often displayed as a blue line) crosses above the long-term MA (usually red), this is a bullish signal. It could indicate an ideal moment to open a long trade (BUY).

- Death Cross: Conversely, when the short-term MA crosses below the long-term MA, it’s a bearish sign, signaling a potential short position (SELL).

Example: The Golden Cross and Death Cross can help you spot key market turns and enhance binary option strategies through clearer entry and exit points.

- Moving Average Convergence Divergence (MACD)
MACD, or Moving Average Convergence Divergence, is known for its versatility. With the ability to indicate trend strength, direction, and even momentum, it’s a preferred choice for many traders. Here’s how to optimize it for binary options.
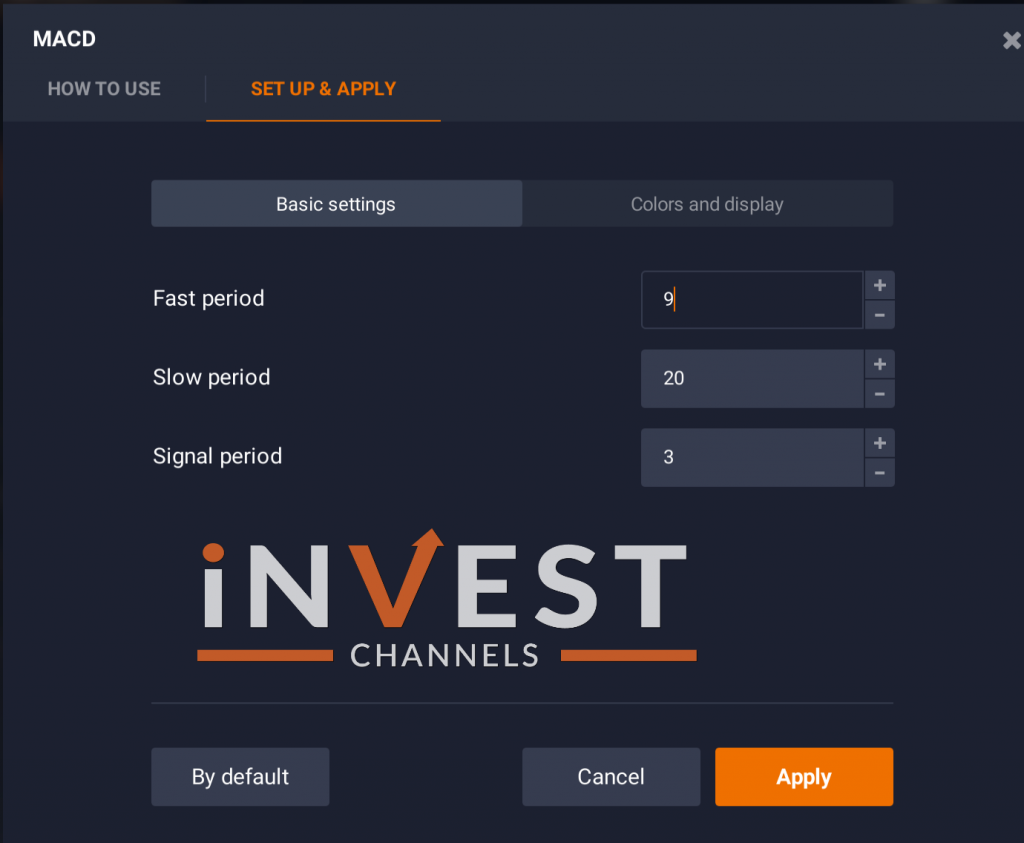
Adjusting MACD Settings for Binary Options:
- For best results in binary options, tweak the short-term MA to 9, long-term MA to 20, and set the signal line at 3.

Reading MACD Signals:
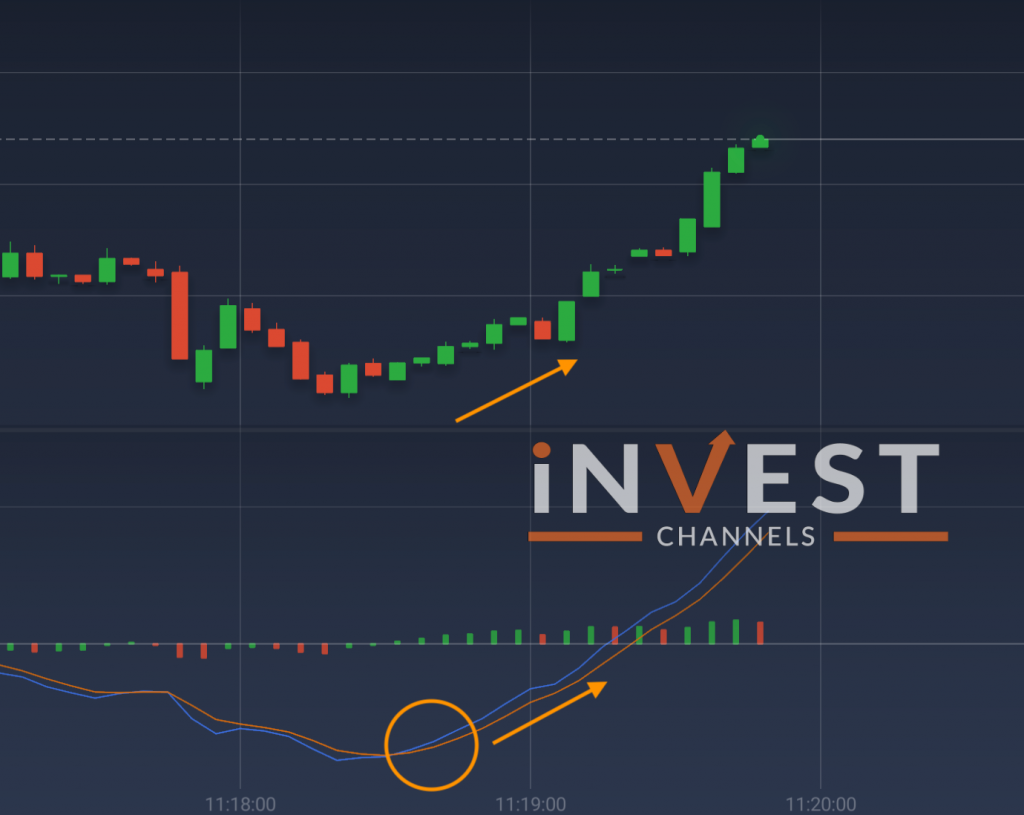
- Bullish Sentiment: If the MACD line (blue) crosses above the signal line (orange), and a candlestick appears above this crossover, it’s a bullish signal.
- Bearish Sentiment: If the MACD line crosses below the signal line, it suggests bearish sentiment, especially when there’s a candlestick above the crossover.

Example: A bullish MACD signal would prompt a trader to open a BUY position, leveraging momentum. A bearish MACD crossover might cue a SELL, capitalizing on trend reversal insights.
- Vortex Indicator
Among binary options traders, the Vortex Indicator is valued for its accuracy and simplicity. It’s based on the principle of crossing lines, with a blue and red line offering clear buy or sell signals.
Using the Vortex Indicator:
- Apply the Vortex Indicator with its default settings.
- Higher Signal: When the blue line crosses above the red line, it’s a signal to press “Higher” (BUY).
- Lower Signal: If the blue line crosses below the red, it indicates a “Lower” position (SELL).
Example: If you observe the blue line moving above the red, it signals market strength, while a drop below suggests a likely decline.

- Stochastic Oscillator
The Stochastic Oscillator is another favorite among binary options traders, valued for its momentum-tracking capability. This tool helps you identify when the market is overbought or oversold by tracking two lines, %K and %D, that oscillate between 0 and 100.
Interpreting Stochastic Signals:
- Overbought (>80): Signals a potential SELL as the market could be topping out.
- Oversold (<20): Hints at a BUY as prices might be due for a rebound.
Buy and Sell Signals:
- Buy Signal: When the %K (blue) line crosses above the %D (red) line below the 20 level, it indicates a BUY signal.
- Sell Signal: When the %K crosses below the %D above the 80 level, it’s a SELL signal.
Example: If the %K crosses above %D while in oversold territory, it’s a signal of potential upward momentum, ideal for a BUY in binary options. A similar crossover in overbought conditions may indicate an opportune moment to SELL.

- Commodity Channel Index (CCI)
The Commodity Channel Index, or CCI, is highly regarded for measuring the trend’s strength and direction. By comparing current price levels to historical price averages, CCI helps traders grasp potential price movements.
How to Use CCI for Binary Options:
- Bullish Trend: If the CCI line moves from 0 towards 100, it’s an indication of an upward trend.
- Bearish Trend: When the CCI moves closer to -100 from 0, it suggests a downtrend.
Trading Strategy:
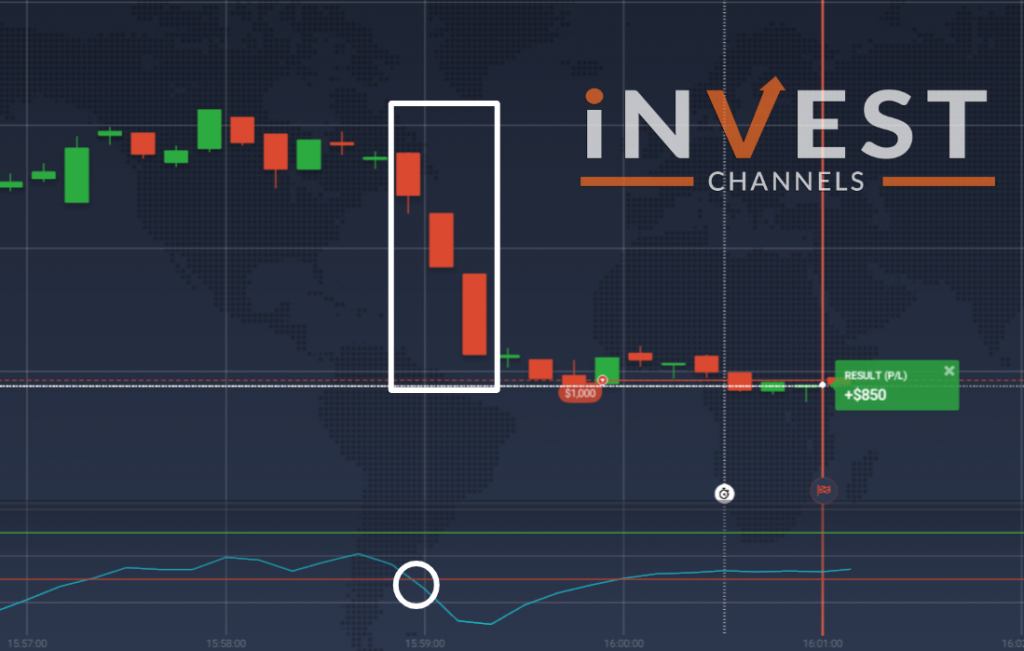
- Wait for 3-4 candles to confirm the trend direction before placing a trade. For instance, if the CCI shows an upward trend, observe a few more candles to ensure sustained momentum.
Example: Suppose the CCI begins moving above 0, followed by a few candles confirming upward movement; this could be a strong BUY signal in a binary options context.

Conclusion
If your goal is to refine short-term trading accuracy, consider these top indicators: Moving Averages for trend identification, MACD for comprehensive trend insights, Vortex for clear entry signals, Stochastic Oscillator to gauge momentum, and CCI for trend strength confirmation.
Mastering these indicators can equip you with valuable insights into market direction, allowing you to make informed trading decisions and increase your odds of success in binary options trading.
Top 5 Trending
"Why do I keep losing money in trading?" This is a question every trader has asked at some point. Experiencing… [Read More]
Trading indices is more than just a financial pursuit; it's both an art and science, demanding attention to detail, a… [Read More]
Forget Tiffany’s—there’s a diamond that traders treasure even more. Diamond chart patterns may not sit on a ring, but they… [Read More]
The Psychological Line (PSY) Indicator is a versatile, oscillator-type trading tool that compares the number of periods with positive price… [Read More]
Have you ever felt like your trading approach could benefit from a little extra energy? That’s where the Relative Vigor… [Read More]


