There are three things you need to consider before entering any trade.
Remember that before entering into any trade there are three things to consider:
Firstly, the trade entry signal. It is important to consider the trade entry signal whether it is a candle, price, or a signal given by a technical indicator that you use.
Secondly, the duration of your position. How long you hold your position will decide the result which largely depends on the market you’re trading.
And third, the exit point. It mostly depends on the market you are trading and is related to the second consideration. Like if you are trading Forex then your exit point would be set by your take profit or stop loss.
You will learn about trading options by identifying 5 different trade entry signals in this guide.
How long to hold position and exit points
As we are trading options, our priority will be to look at how long each position will last. In this guide, the EUR/USD currency pair trading will be done. Also, the Japanese candle will be used with 5-minute interval candles and will last for 15 minutes.

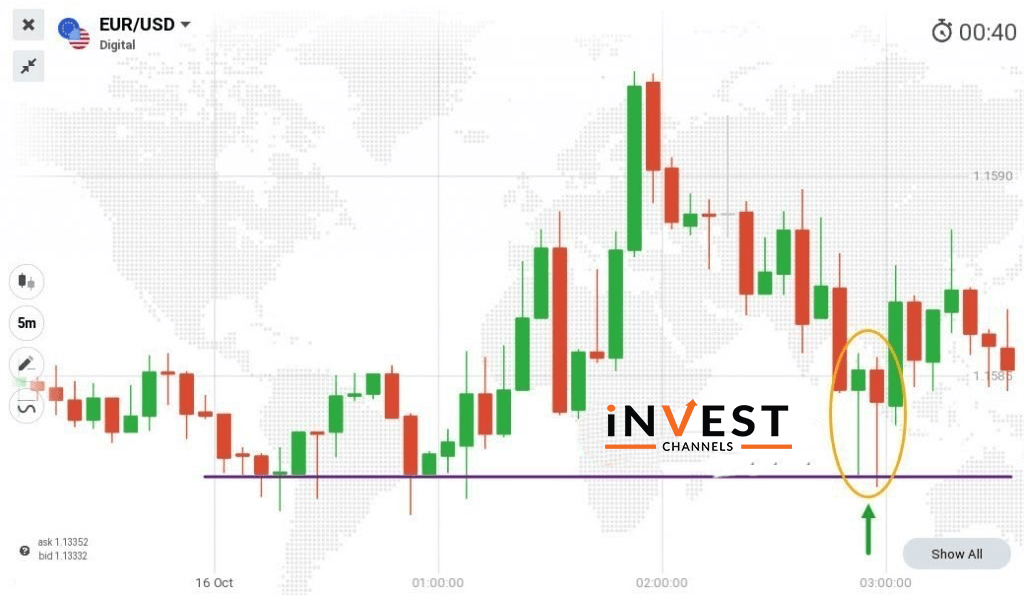
First trade: Signal is 2 bullish pin bars with lows touching strong support
According to the chart, a support line is drawn which touches the lows within a ranging market. As the support touches multiple lows, it is strong support. As the larger candles develop, two bullish pin bars appear with their low touching the support. At this point, the expectation is that the price will bounce back up.
And here 15-minutes buy position will be entered. And the entry point will be at the close of the second bullish pin bar.
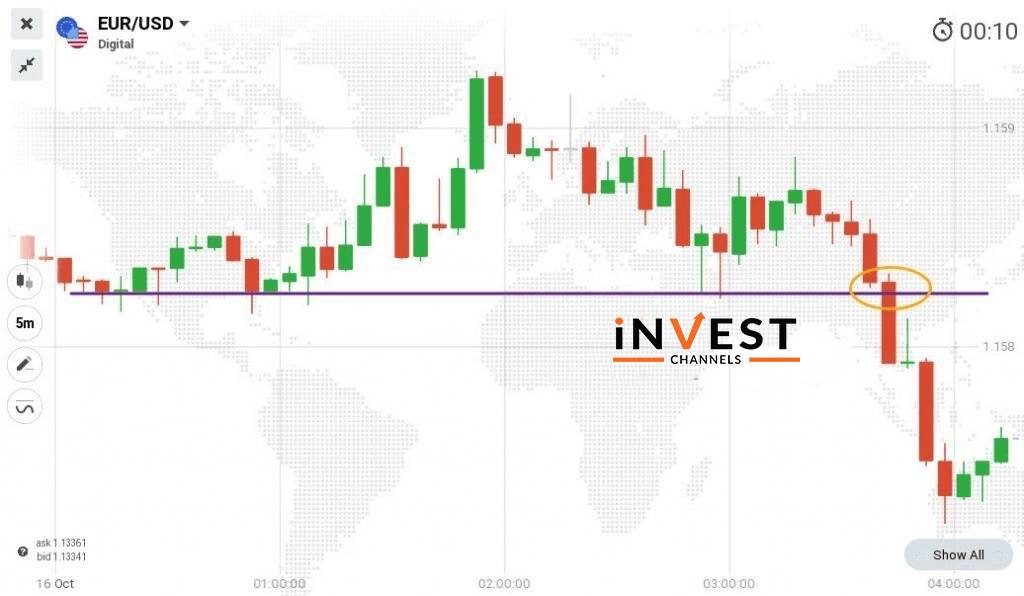
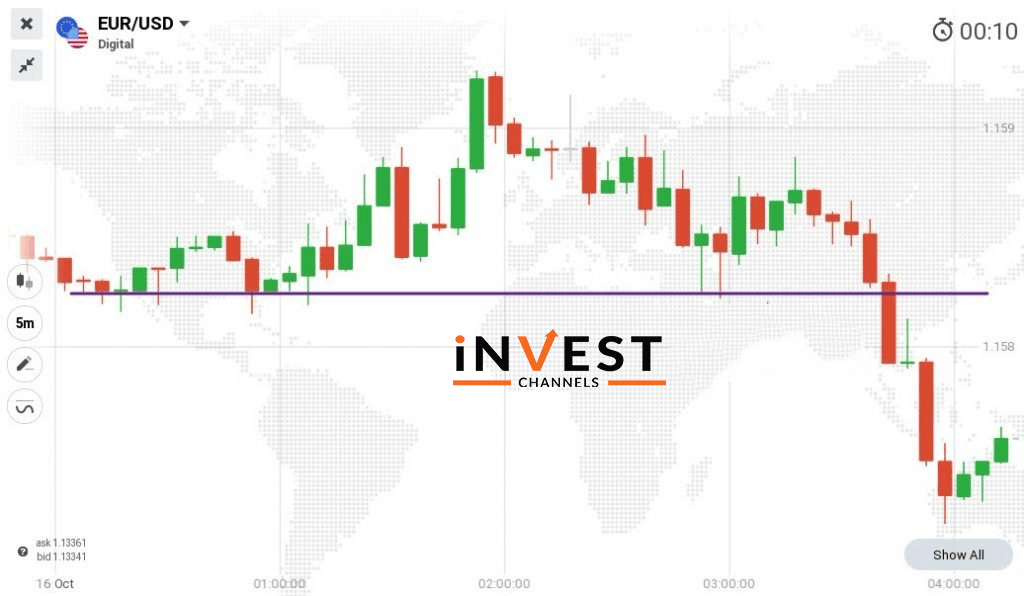
Second entry point: Price breaks the support
Here the price does not proceed on an uptrend which is indicated by the bearish pin bar. But this is not the entry point we are looking for. The trade entry point would be where the price broke the support line as the bearish candles are getting bigger. So, at this point, the 15-minute sell position is entered.
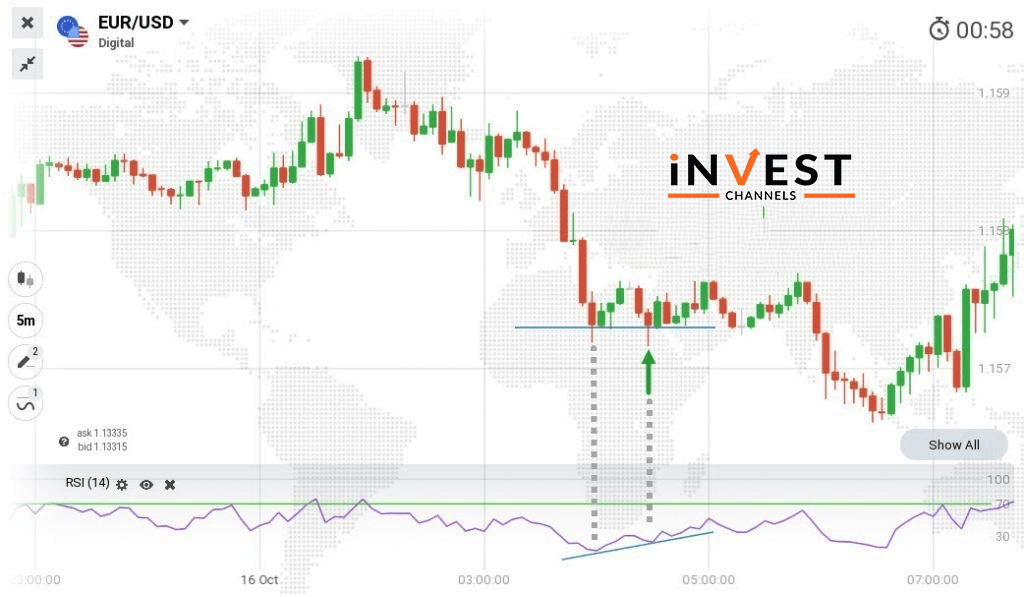
Third entry point: Hammer develops on support and RSI rising
The market will start ranging again when the downtrend becomes exhausted and a bullish candle will develop. But as the market was ranging it was difficult to determine the direction. As RSI rising it made it confirm that the prices will go up. Therefore a 15-minute buy position is entered with the entry point being the price at support.
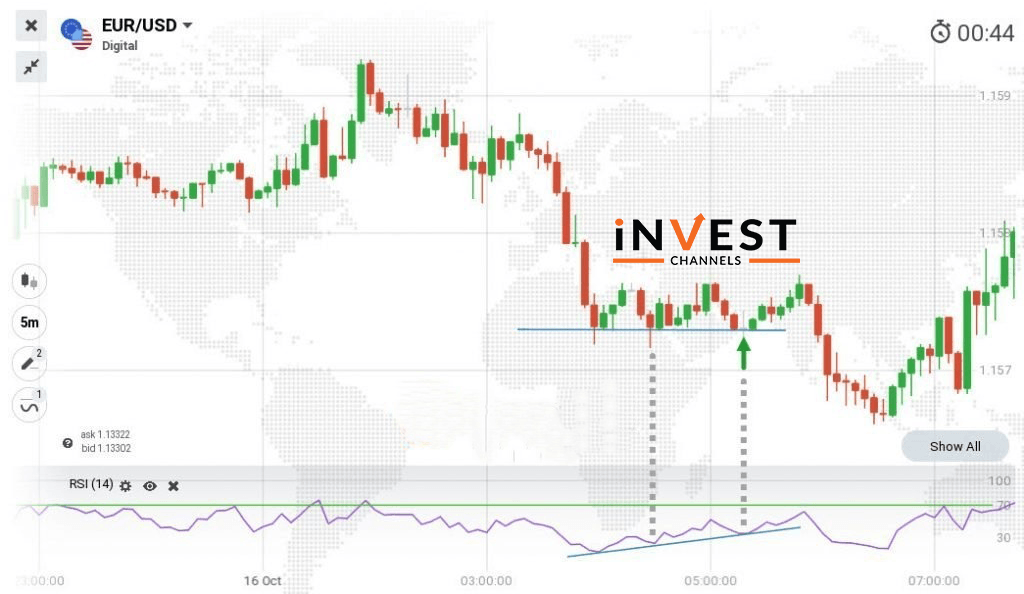
Fourth entry point: Doji forms on support and RSI rising
Since Doji candles are indecision candles to trade with, to make them effective, look after the candle that forms after them. As you can see below the chart that the formation of Doji is at the support level. After the Doji forms bullish candle develops and wait till the next candle develops in order to enter positions. As it was a bullish candle a 15-minute buy position is entered.
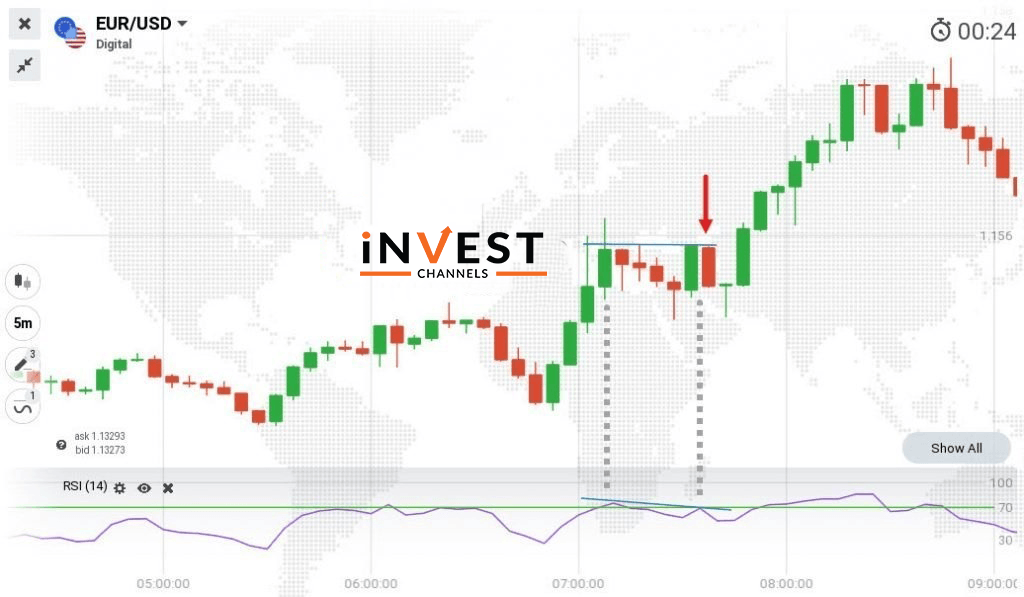
Fifth entry point: Dragonfly Doji forms after a solid bearish candle
You will notice in the below chart that the trend is rising before ranging and the RSI drops under the 70. Many traders consider it for sell but if you see the chart a dragonfly Doji forms just after a solid bearish candle.
By this, you can judge that the bulls aren’t yet ready to give up control of the markets so, at this point, a good thing is to wait until the next candle after the Doji.
Summary of the 5 trade entry points
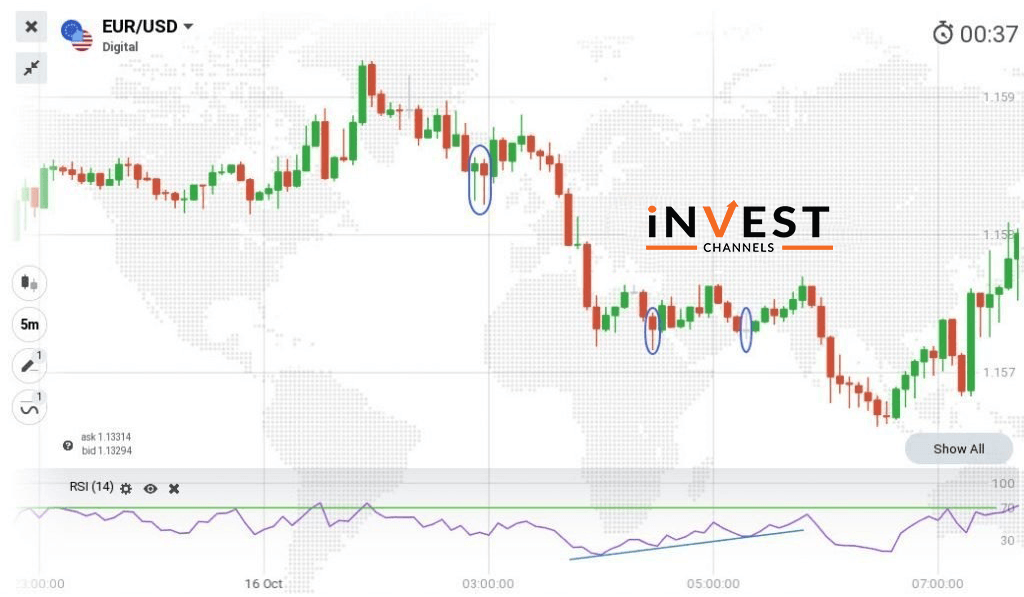
At the first trade, it was 2 bullish pin bar candles and both had their lows touching the strong support signal.
Continuing to fall and the price breaking support signals the second trade entry.
Hammer candle which indicated prices were going up signals the third trade entry and was further confirmed by the rising RSI.
The fourth trade was signalled by a Doji that formed along with the support. RSI was rising and the next 2 candles were bullish.
Dragonfly Doji that formed after a bearish candle signals the final trade entry.
Conclusion
Master the art of identifying trade entry signals to succeed as a trader on IQ Option. you just need to learn to identify different candle patterns and to draw support and resistance lines as well as the use of a simple indicator such as RSI.
So, as you have learned different trade entry signals it is time to do it on the practice account.
Good luck!
Top 5 Trending
"Why do I keep losing money in trading?" This is a question every trader has asked at some point. Experiencing… [Read More]
Trading indices is more than just a financial pursuit; it's both an art and science, demanding attention to detail, a… [Read More]
Forget Tiffany’s—there’s a diamond that traders treasure even more. Diamond chart patterns may not sit on a ring, but they… [Read More]
The Psychological Line (PSY) Indicator is a versatile, oscillator-type trading tool that compares the number of periods with positive price… [Read More]
Have you ever felt like your trading approach could benefit from a little extra energy? That’s where the Relative Vigor… [Read More]


