The trendline is one of the useful tools provided by IQ Option. It’s primarily used to track price movements along with a trend. On the IQ Option platform, it’s presented as a graphical tool. This means you’ll have to draw it on your chart rather than have the platform apply it automatically.
Since it’s used to track the current trend, the trendline is drawn to connect higher-lows in an uptrend. On the other hand, it’s also drawn to connect lower highs in a downtrend.
Knowing how to draw and use the trendline is one of the important skills you’ll need to develop to become a successful options trader. This guide will show you how to do just that.
Note: I’ll primarily focus on using the trendline to trade an uptrend. The same principles apply when trading a downtrend.
Key concepts you need to understand regarding an uptrend
Uptrend: This is characterized by prices moving higher. Here, bulls are dominating the market and the chart shows longer bullish (green) candles developing. The trend forms higher peaks as the prices keep moving up. In the diagram below, the peaks (2 and 4) continue getting higher.
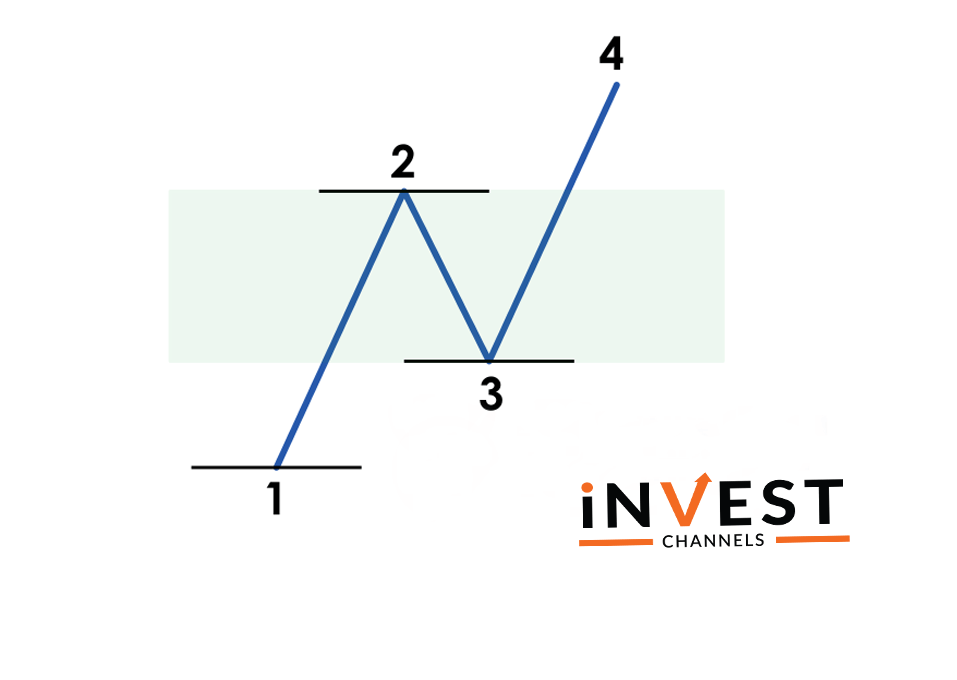
Price adjustment: An uptrend doesn’t mean that sellers are sitting on the sidelines. There will be many attempts by sellers to bring prices down. This results in price fluctuations. When sellers temporarily take control of the markets, the prices will temporarily fall. This is a price adjustment. However, buyers soon take control of the markets driving prices higher.
In the diagram below, the price adjustment occurs between 2 and 3. At point 2, buyers are the dominant force. However, sellers step in driving the prices down to point 3 before buyers eventually take control driving prices up to point 4.
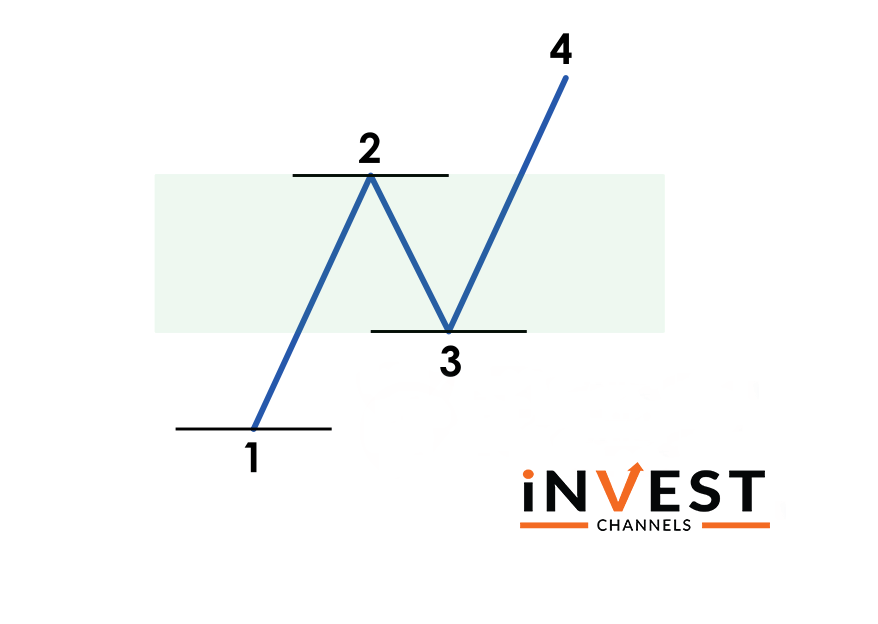
You should note that any trend will have some price adjustments. In the case of an uptrend, you’ll notice that the bullish candles will have some bearish candles tucked between them. These adjustment areas form the support and resistance levels along with the trend.
Using the trendline to trade uptrend on IQ Option
In order to use a trendline on IQ Option, you’ll need to draw it first. Open a Japanese candles chart with 1-minute interval candles.
Next, click on the graphical tools feature and select trendline. On an uptrend, connect the higher-lows with the trendline as I’ve done in the snapshot below.
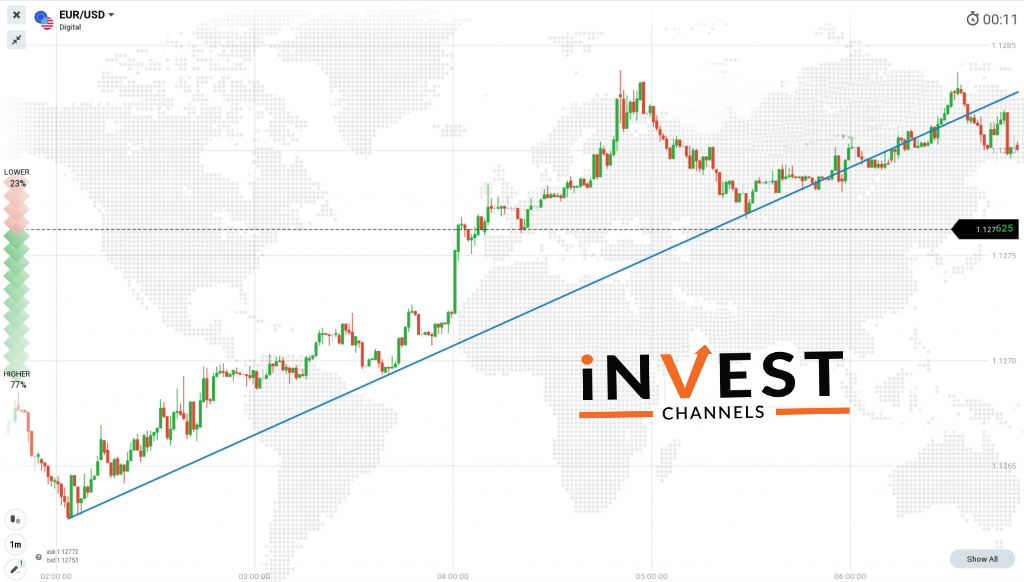
Where to enter trades when using a trendline on an uptrend on IQ Option
Consider the chart below.
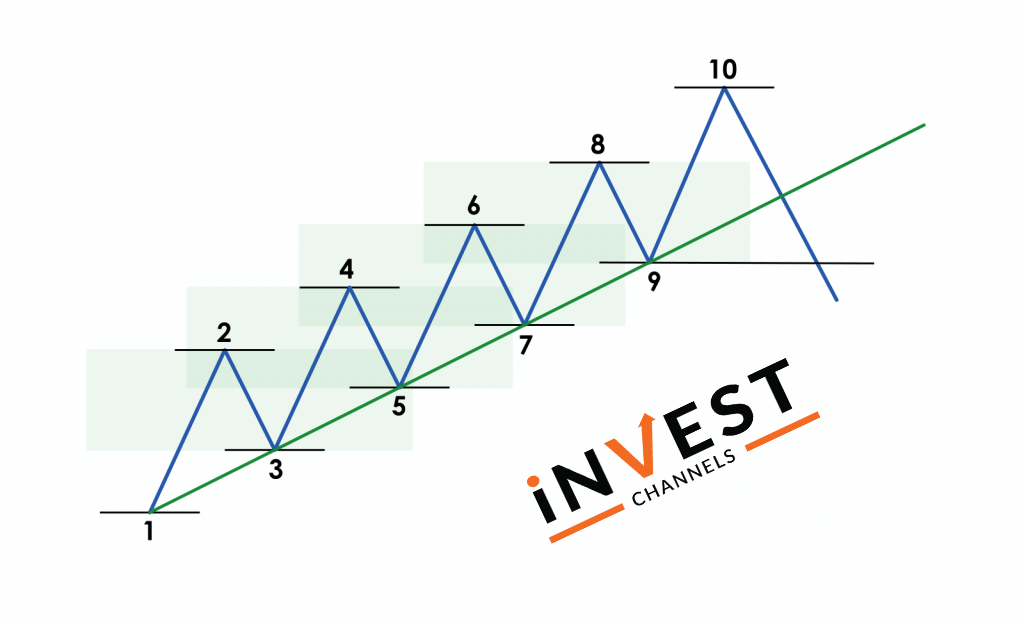
Using the above chart, you’ll notice that the uptrend has peaks 2, 4, 6, 8 and 10. At these points, the price bounces back (price adjustment) before resuming the trend. Never enter into a trading position at these levels. It means you’ll have to enter a sell position which isn’t recommended when the trend is up.
The best points to enter buy positions are 3, 5, 7 and 9. As the trend progresses, your trade positions should be shorter. Remember that the trend is bound to reverse any time in the future. If you manage to enter a position at 3, your buy trade should last considerably longer than if you entered a position at 5 or 7.
Trendlines are a good tool to use when you want to confirm a true trend. It comes in handy when you’re trading long positions. As you’ve seen, it’s quite simple to draw and use a trendline on your charts.
Now, head over to your IQ Options practice account and try out this feature. We’d love to hear about your results in the comments section below.
Good luck!
Top 5 Trending
"Why do I keep losing money in trading?" This is a question every trader has asked at some point. Experiencing… [Read More]
Trading indices is more than just a financial pursuit; it's both an art and science, demanding attention to detail, a… [Read More]
Forget Tiffany’s—there’s a diamond that traders treasure even more. Diamond chart patterns may not sit on a ring, but they… [Read More]
The Psychological Line (PSY) Indicator is a versatile, oscillator-type trading tool that compares the number of periods with positive price… [Read More]
Have you ever felt like your trading approach could benefit from a little extra energy? That’s where the Relative Vigor… [Read More]

