One of the advantages of trading on the IQ Option platform is that you can trade on both desktop computers and smartphones. Although smartphones provide convenience, the IQ Option app doesn’t feature many assets. But this should not worry you.
This guide will show you how to trade digital options which are available on both iOS and Android smartphones. I’ll use a simple trading strategy – trading with candle colours. This means I won’t have to rely on indicators that are also quite limited on the IQ Option smartphone apps.
Let’s get started.
Guidelines for trading on your IQ Option smartphone app
Since we’ll use candles, our chart will be the Japanese candles with 5-minute interval candles.
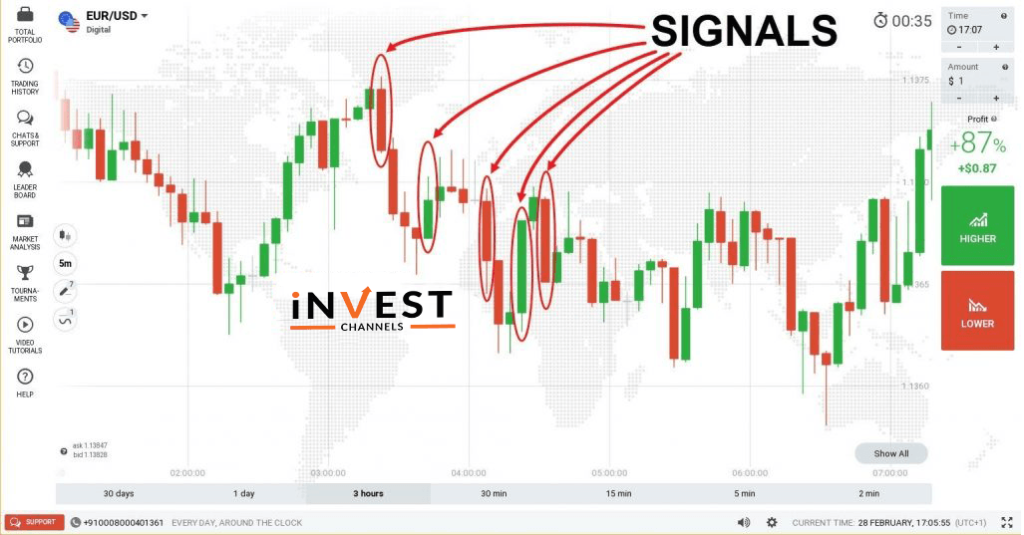
When trading candles, you should look for full candles. The close of the full candle will be your trade entry signal. If the candle is bullish, you should enter a 5 minute buy position. If it’s bearish, you should enter a 5-minute sell position.

IQ Option price chart showing trade entry points
Let’s use the chart above.
My trades will be as follows. If I enter a buy position, the next trade will be a sell position. Ideally, I will look for a full candle before entering a trade position. If the first full candle is green, I’ll enter into a buy position immediately after the candle ends. Next, I’ll wait until an orange candle develops. I will then enter a sell position once this candle closes. I’ll keep repeating this process until I’ve made 5 to 7 trades.
There’s one condition for this rule though. I’ll only cycle through buy and sell positions if the trades are successful. If for example I enter a buy position but the candle closes lower, I’ll immediately enter a buy position for the next candle. If this candle closes lower, I’ll still enter a buy position until the price closes higher.
Let’s trade using the chart above.
Trade entry points

The first trade entry is at the close of the first bearish candle on the chart. The trade lasts 5 minutes and is in a “lower” position. This was profitable.
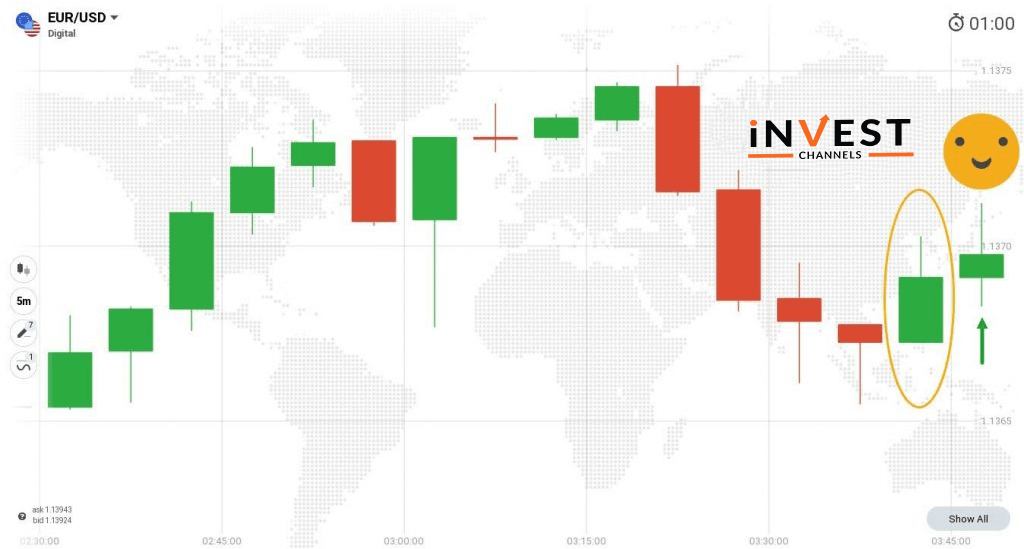
The second trade entry is at the close of the bullish candle. I’ll enter a “higher” position that will last 5 minutes.
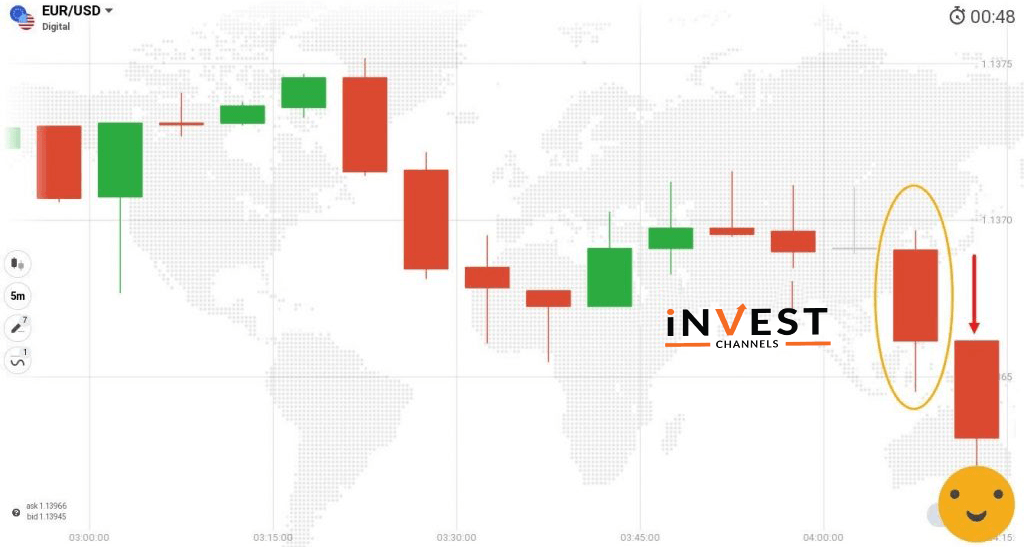
The third trade entry is at the close of the bearish candle. Here, I entered a 5 minute “lower” position.
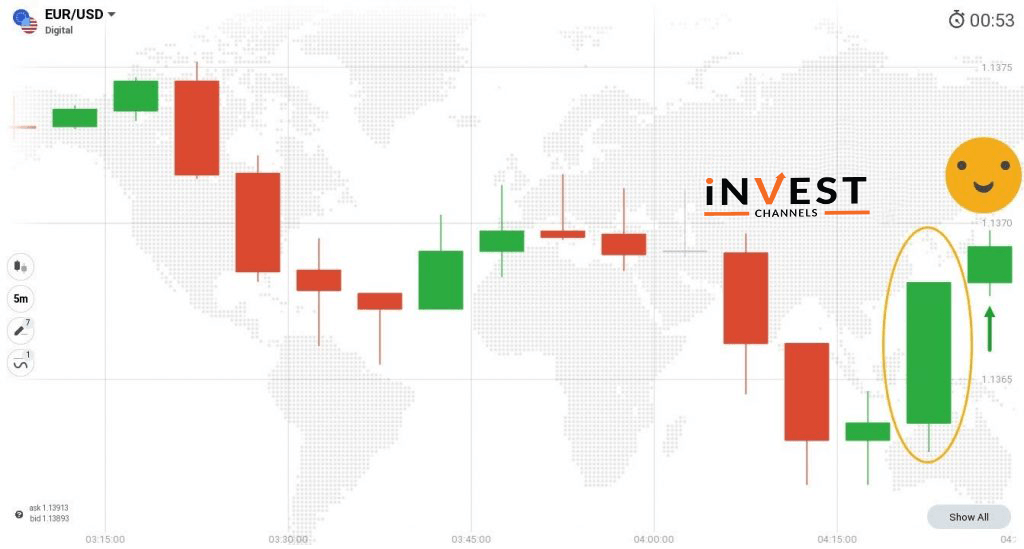
The fourth trade is at the close of the bullish candle. I entered a “higher” position that lasted 5 minutes.
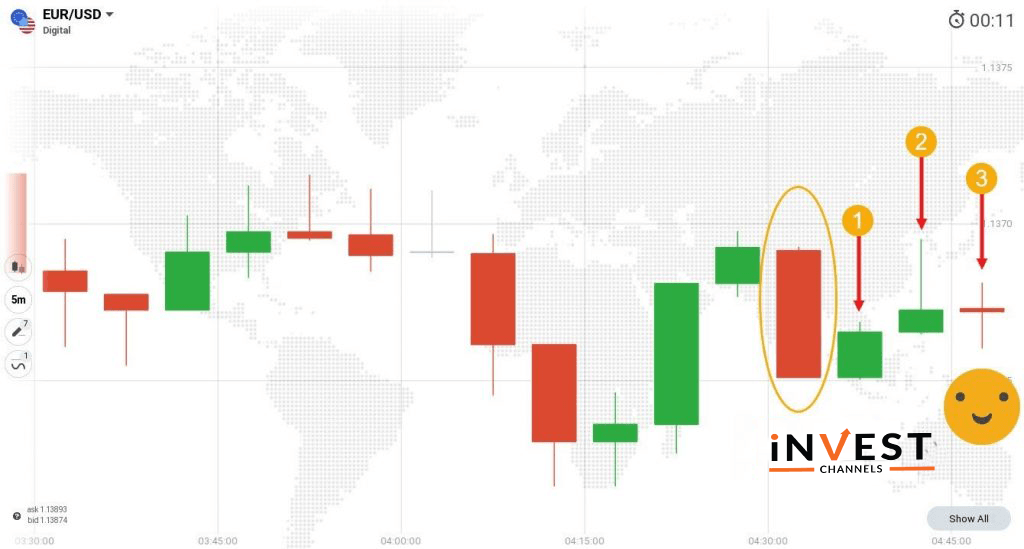
The fifth trade was a loser. The trade entry was at the close of the bearish candle. I entered a “lower” position lasting 5 minutes. Remember the exception I explained before – trade the same candle colour until the trade is successful.
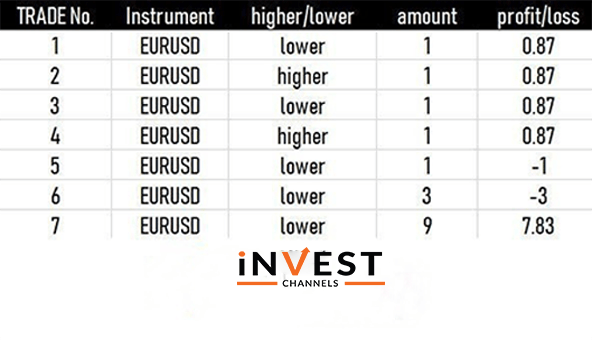
I, therefore, entered two consecutive “lower” positions for trades 6 and 7. Trade 6 was also a loser. However, trade 7 turned profitable.
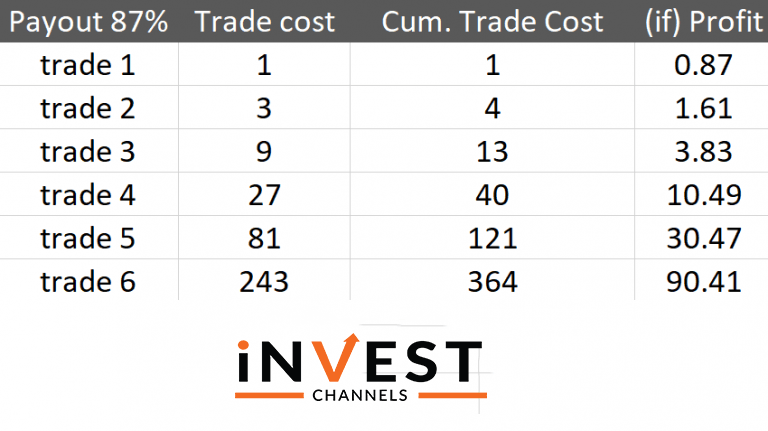
Using the Martingale System, I only traded the same amount for successful trades. When a trade lost, I increased the trading amount. This ensures that I’m able to recover the losses on winning trades. Take a look at the money management table that resulted from these 7 trades below.
How easy is it to trade using the IQ Option smartphone app?
As mentioned before, the IQ Option smartphone app comes with limited features. If you’re a beginner trader, I’d advise you to first try out the practice account on your smartphone. This will allow you to get a feel of how the app is.
You might notice some lag in the price charts. This is primarily due to network connectivity. If you notice this, stop trading and make sure that you have fast WiFi or 4G. In addition, make sure that your smartphone doesn’t have too many apps installed which can slow down the device.
If you’re trading using the IQ Option smartphone app, one of the easiest ways to make money is by trading based on candle colour. You don’t need to use any indicators which help to de-clutter your trading interface. If you use the Martingale system, it’s very likely that you can make at least 2% to 5% profit from just a few trades per day.
Have you traded using the IQ Option smartphone app? How did it work out for you? Kindly share your results in the comments section below.
Good luck!
Top 5 Trending
In the world of online trading — often filled with risk and uncertainty — verifying the credibility of a platform… [Read More]
Starting your trading journey can feel overwhelming — there are countless assets to choose from, and it’s hard to know… [Read More]
"Why do I keep losing money in trading?" This is a question every trader has asked at some point. Experiencing… [Read More]
Trading indices is more than just a financial pursuit; it's both an art and science, demanding attention to detail, a… [Read More]
Forget Tiffany’s—there’s a diamond that traders treasure even more. Diamond chart patterns may not sit on a ring, but they… [Read More]

