One of the popular and simple indicators on the IQ Option platform that you can use is The Simple Moving Average (SMA). This indicator you can use to indicate good places for entering into trading positions.
Keep reading to learn how to use the SMA20 indicator for trading on the IQ Option platform.
Setting up the SMA20 indicator
For an explanation in this guide, a 5-minute candle interval Japanese candles chart for the EUR/USD pair will be used.
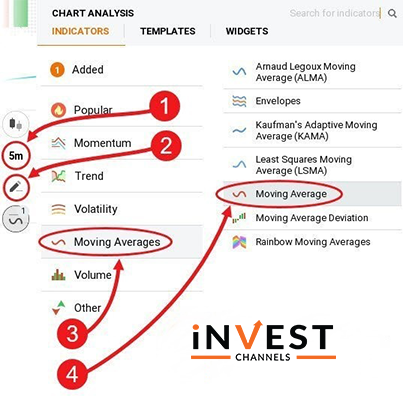
Click on the indicator feature with your chart set up and select Moving Averages.

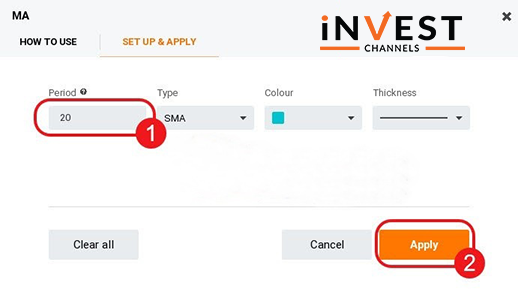
Now on the MA window, keep the type SMA and enter 20 as the period. Through this, you will learn about the basics of setting up SMA and trading with it on IQ Option.

Guidelines for trading using SMA20 indicator
The main objective for using SMA20 is to identify points at which the line cuts the prices along with the trend.
The trend will likely continue moving down if the SMA20 moves from above the prices and touches or cuts across a bullish candle. The confirmation of the downtrend is by a bearish candle developing after the bullish candle and the remaining SMA20 above the prices.
The uptrend will likely continue when the SMA20 moves from below the prices and touches or cuts across a bearish candle. And the confirmation of uptrend is further got by a bullish candle developing after the bearish candle. In addition, the SMA20 continues moving under the prices.
Take a look at the two price charts below.


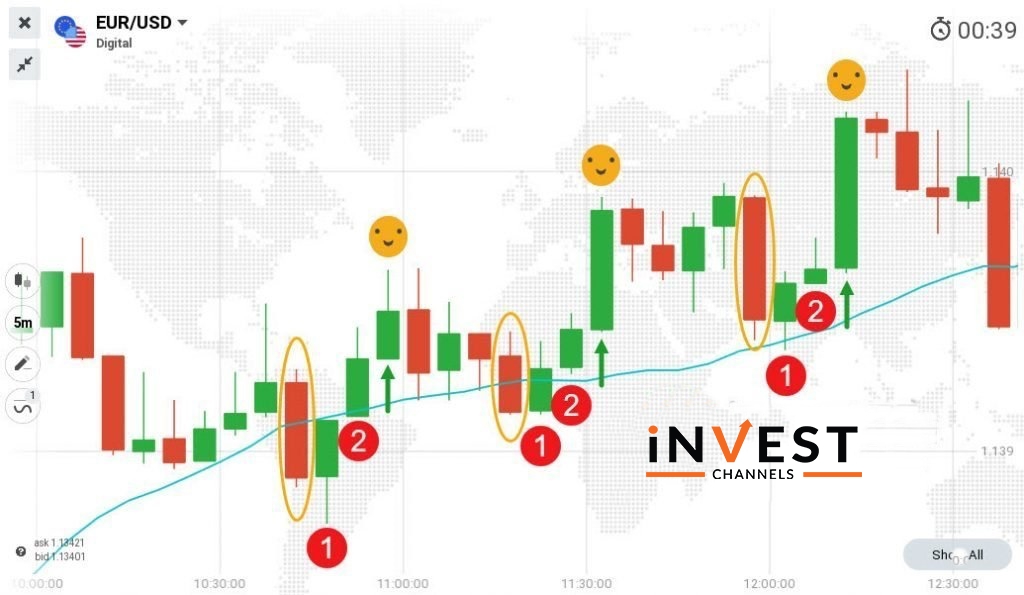
Example with 3 trade entry points signalled by SMA20

The entry point of the first trade is signalled by the SMA20 moving under the prices and cutting across a bearish candle. You will notice the next bullish candle that develops. The SMA20 continues moving under the prices. At the opening of the next bullish candle, you should therefore enter a 5-minute buy position.
The second trade entry point is similar to the first. Just before a bullish candle develops the SMA20 cuts across a bearish candle. The SMA20 continues moving under the prices. At the opening of the second bullish candle, that should be the entry of your trader.
The third entry point will be a bit different. The SMA20 almost touches the candle’s low and doesn’t cut across a bearish candle. And after this candle, a bullish candle develops. So, your trade entry should therefore be at the open of the second bullish candle that develops.
Trade entry signals when using SMA20
The main advantage to use the SMA20 indicator is its simplicity and all you need to look at is where it touches or cuts across a candle. Next relative to the next candle you’ll need to look at the SMA20 line’s position. And at the end enter your trade position based on this analysis.
Now after the development of the second candle there should be the entry of your trade. This way you will be sure about the colour of your candle and the price direction based on the SMA20 line’s position Each trade should last 5 minutes.
Is SMA20 a good indicator to trade with?
Due to the lag, most traders argue that SMA is not a good indicator to trade with. Well, it is a good technical analysis tool for use when the markets are trading.

Given the examples I’ve used above, it’s easy to see that this indicator is safe to use. As long as you’re able to identify the SMA20’s movement relative to the prices, you should be able to get consistent results.
When the markets have high volatility, the SMA20 doesn’t work well. Consider an example, when a news item causes the prices to suddenly change.
Capital management strategy when trading with SMA20 on IQ Option
As far we have seen you can notice that the SMA20 indicator can bring in consistent winning trades. This works as a good strategy for making relatively high profits from a few trades.
Here you can use a money management strategy and you can start with the usual 2% to 5 % of your account balance. Then you can invest your winning plus as an initial investment for subsequent trades.
Now consider an example, if you have a $100 account balance then your first trade amount will be $2 with the return of 80% and you will make a profit of $1.6. Therefore you would invest $3.6 in your subsequent trade regardless of whether your first trade was profitable or not.
So, even if you make 3 trades per day, you will end up profitable by this money management strategy.

Be psychologically prepared when trading SMA20
Using SMA20, trading might seem simple but it requires a lot of patience. It can also take minutes or even hours before the right signals present themselves. You have to patiently analyze the price charts.
It is recommended to wait until the SMA20 crosses the price charts when the right conditions present themselves and you miss the opportunity to enter a position. Here the trade will result in loss.

As you have learned about the SMA20 indicator on IQ Option, now you can try it out on your IQ Options practice account and can practice this strategy.
Good luck!
Top 5 Trending
"Why do I keep losing money in trading?" This is a question every trader has asked at some point. Experiencing… [Read More]
Trading indices is more than just a financial pursuit; it's both an art and science, demanding attention to detail, a… [Read More]
Forget Tiffany’s—there’s a diamond that traders treasure even more. Diamond chart patterns may not sit on a ring, but they… [Read More]
The Psychological Line (PSY) Indicator is a versatile, oscillator-type trading tool that compares the number of periods with positive price… [Read More]
Have you ever felt like your trading approach could benefit from a little extra energy? That’s where the Relative Vigor… [Read More]


