Trade with the trend is an old mantra that is followed by professional traders and they believe that trading with the trend increases the odds and makes your trade profitable.
But first, you need to identify the trend and the best trade entry points. professional traders can easily do this without the need for indicators or other special tools.
This guide will show you how to draw a trend line, support, and resistance, and how to use them to trade on the IQ Option platform.
Setting up a trend line
Trend lines are used for the direction of a trend and the steepness of the trend line will show you and give an idea about the trend’s momentum and indicate the price that is moving in a certain direction.
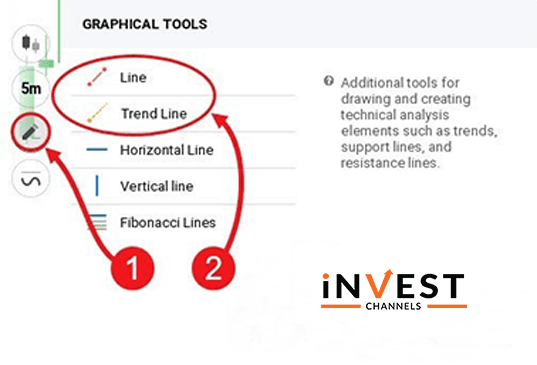
Click on the graphical tools feature on your IQ Option trading interface to set this indicator up. Then select the trend line.
Zoom your chart in and out and recognize the time period that shows the best trend.
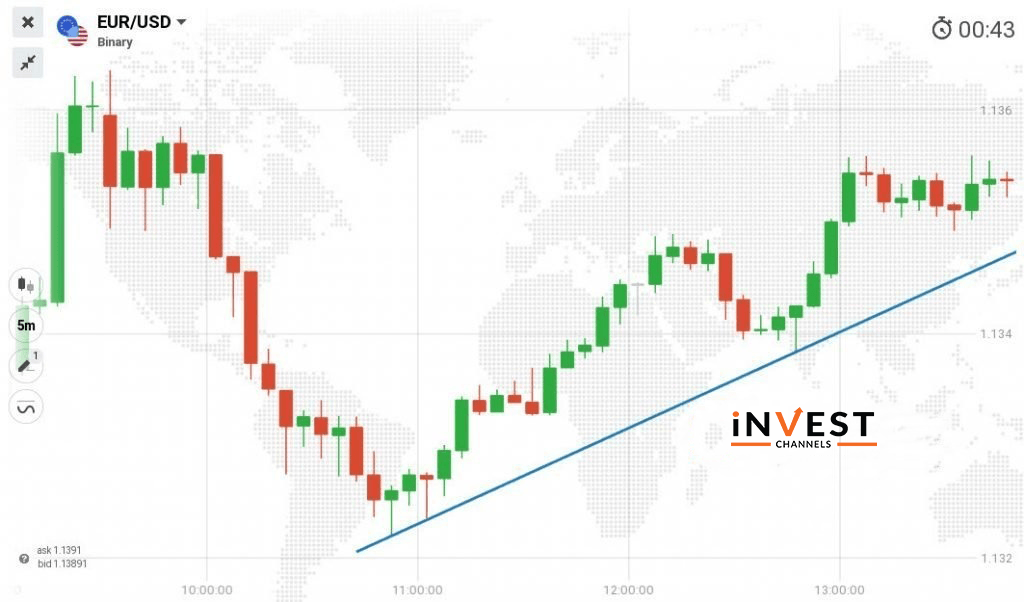
Now click on the lowest price by touching all higher or lower if it is an uptrend. Remember that it is not compulsory for the trend line to touch all highs or lows, It only needs to connect 2 highs or 2 lows.
The chart below shows a trend line drawn along an uptrend.
Adding support and resistance to your IQ Option chart
After setting up your trend line, add support and resistance levels which are simply price ranges where retracement and consolidation occur. The upper line along an uptrend is the resistance where prices tend to reach before bouncing back. The lower line along with the uptrend where prices don’t seem to fall below for a given period is the support. In the case of a downtrend, it is upper.
Support and resistance are not fixed, they keep changing. New support and resistance levels are created when the price breaks out of a support or resistance level
Now let’s look at an example.
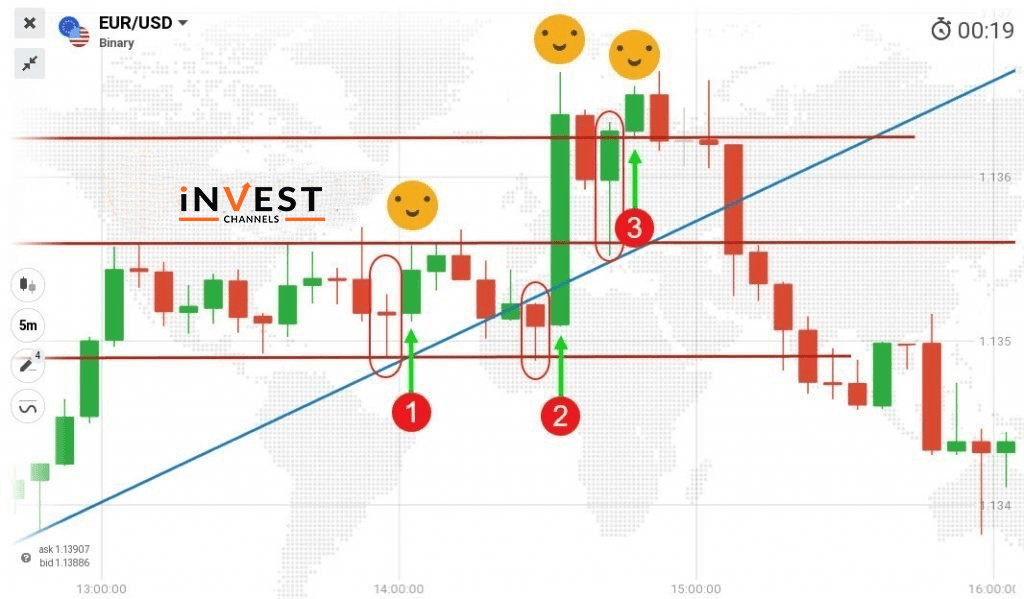
With the help of this chart, the Lowermost horizontal line is the support and it eventually becomes the resistance when the downtrend starts developing.
As you can see the middle horizontal line that forms a strong resistance along with the uptrend, you will notice that the price hits this level and bounces back down before breaking out to continue the uptrend.
The uppermost line forms the resistance for the uptrend.
Now, notice the trade positions to enter with these three lines.
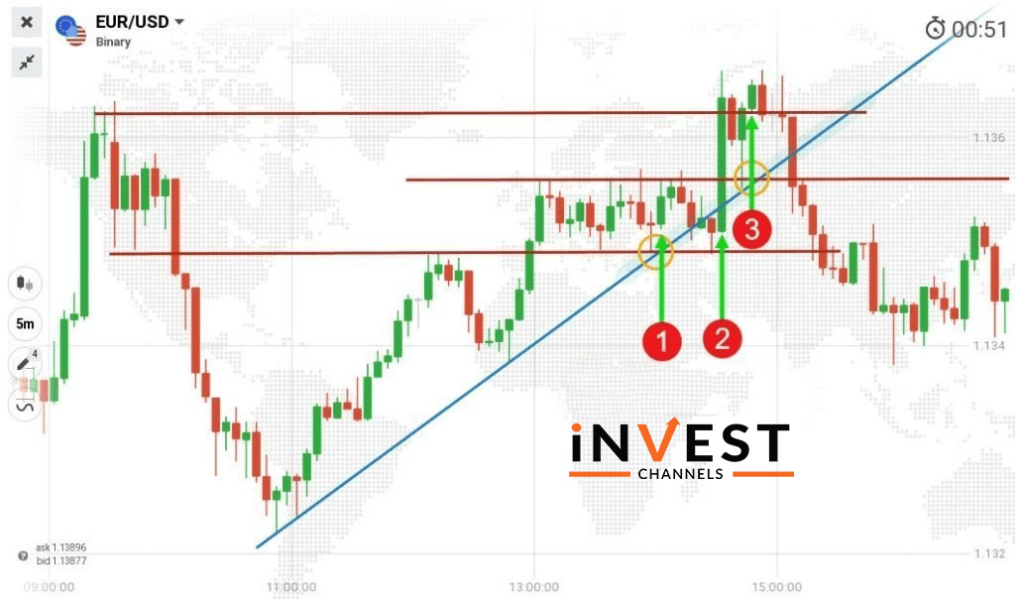
The next trade entry is also signalled by a bullish pin bar. The only difference is that its low touches the support and the trend line touch its open. Since it’s a bullish pin bar, your trade entry should be at the opening of the next candle (2).
The final trade entry point is also signalled by a bullish pin bar. What sets it apart from the others is that its low falls within the zone where the trend line intersects with very strong resistance. Being a bullish pin bar, you should enter a buy position at the opening of the next bullish candle (3).
In case you’re wondering how long the trades should last, each position should last 5 minutes (one candle interval).
Now that you’ve learned how to trade using the trend line alongside support/resistance, I urge you to try out this strategy on your IQ Options practice account. We’d love to hear about your results in the comments section.
Good luck!
Top 5 Trending
"Why do I keep losing money in trading?" This is a question every trader has asked at some point. Experiencing… [Read More]
Trading indices is more than just a financial pursuit; it's both an art and science, demanding attention to detail, a… [Read More]
Forget Tiffany’s—there’s a diamond that traders treasure even more. Diamond chart patterns may not sit on a ring, but they… [Read More]
The Psychological Line (PSY) Indicator is a versatile, oscillator-type trading tool that compares the number of periods with positive price… [Read More]
Have you ever felt like your trading approach could benefit from a little extra energy? That’s where the Relative Vigor… [Read More]

