One of the skills every trader must acquire is identifying patterns on the price chart. If you trade long enough, you’ll notice certain patterns repeating themselves almost at the same time interval every day. This could be in the morning hours, afternoon or evening. If you notice such a pattern on IQ Option, it’s best to develop a strategy to profit from it each time it develops.
One pattern that commonly develops along with trends is the stair steps pattern. This guide will show you what it looks like and an easy way to trade it using a trendline.

Overview of the Stair Steps pattern
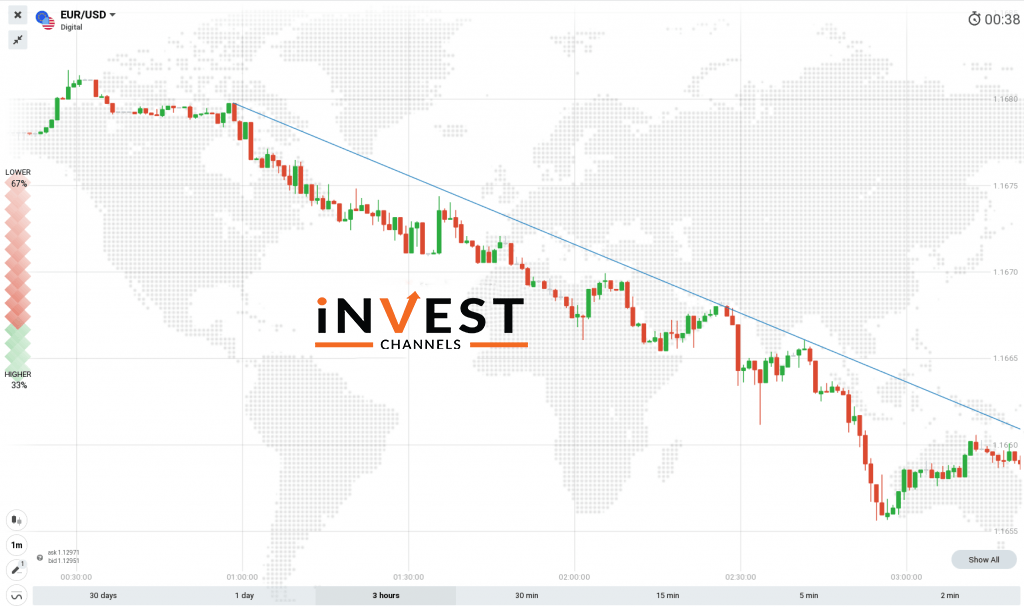
The stair steps pattern develops along with a trend. In the case of a downtrend, prices will experience sharp drops (long consecutive bearish candles) followed by price adjustments in repeating cycles. The result is a pattern that looks like stairs steps. The price adjustment zones will create new support and resistance levels from which breakouts occur continuing the trend.
Take a look at the chart below.

You’ll notice that once a trendline is drawn to connect the lower-highs in the downtrend above, the line touches the breakout points of the resistance levels. These breakouts occur after a period of price adjustment before the trend resumes downward movement. Right where the breakout occurs, you’ll notice that the pattern looks like the steps on a staircase.
Looking at the stair steps pattern alone doesn’t give you much information. But coupled with the trendline, you will have an idea about where prices are likely to break out and continue with the previous trend.
How to trade using the stair steps pattern with a trendline on IQ Option
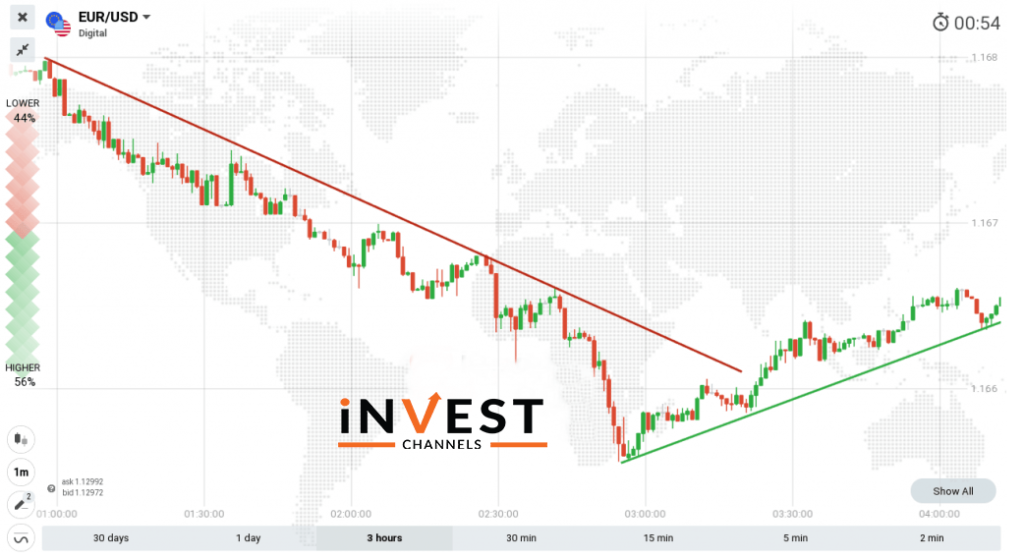
Using the chart below, you’ll notice that a stair steps pattern has developed along with the downtrend. A similar pattern forms when the trend finally reverses adopting an uptrend. So how do you trade this pattern?

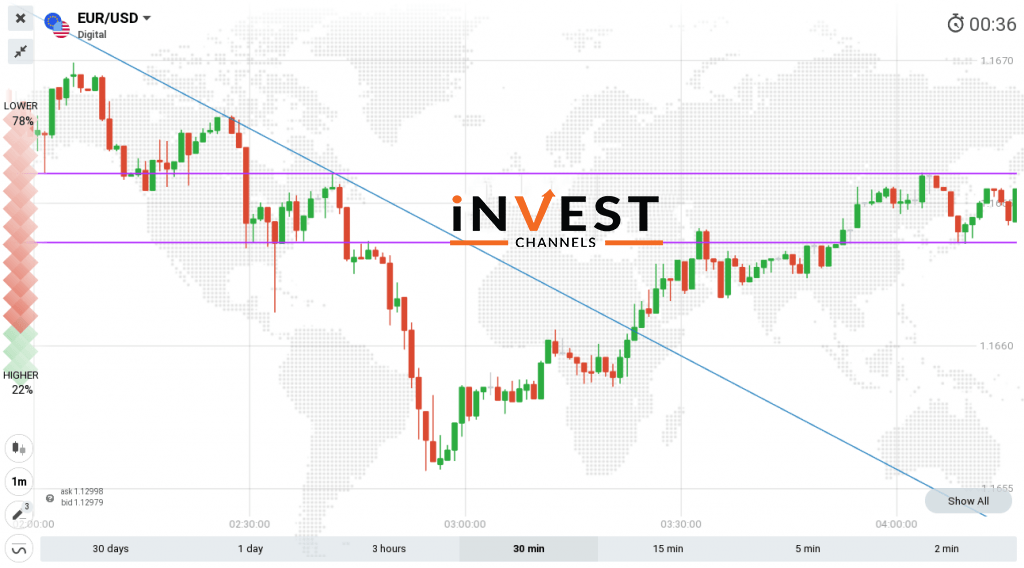
First, you’ll need to draw the support and resistance levels that form along with the trend. Take a look at the chart below.

Enter long sell positions when trendline touches breakout point on a downtrend
After the price adjustments occur along with the downtrend, a sharp price drop follows (breakout) creating new resistance levels. Right, where the price breaks out is the perfect place to enter a long sell position. You know that the trend will continue moving down once the breakout occurs. If you’re using 1-minute interval candles, your trades should last 5 minutes or more.
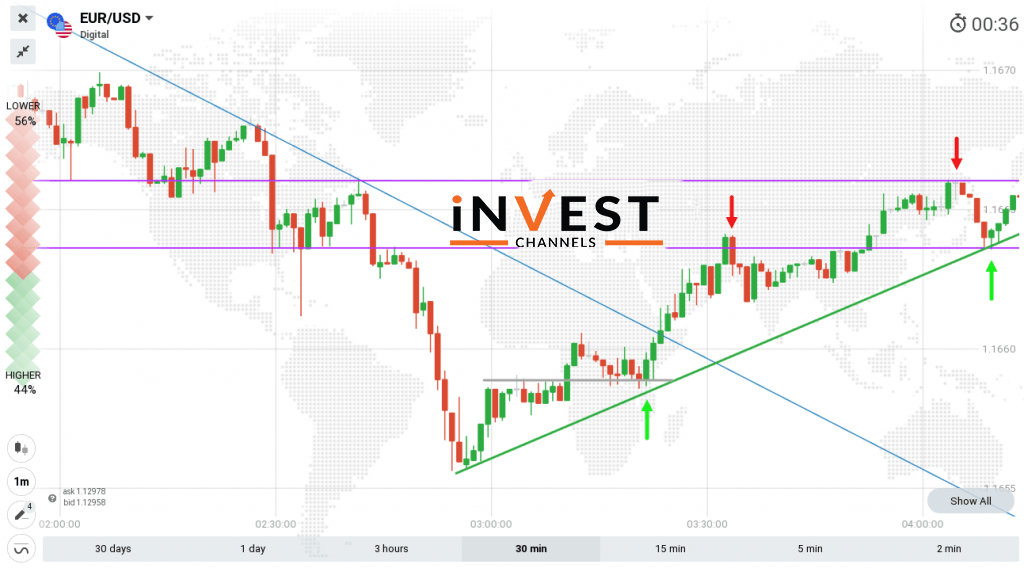
Enter short sell positions when prices touch resistance levels on an uptrend
Once the trend finally reverses, you’ll notice that price adjustments along the uptrend will occur at around the same resistance levels that formed during the downtrend. Once prices touch these levels, you should enter short sell positions lasting 1 to 5 minutes.
Enter long buy positions when the trend finally reverses
Still using the chart above, the downtrend finally ends and a new uptrend develops. At the point of reversal, you should enter a long buy position.
You’ll also notice that there will be some price adjustments along the new trend forming new support and resistance levels. Here, you can enter short sell positions as described above.
Trading the stair steps pattern with the trendline is an easy way to identify possible trade entry points along with a trend. The stair steps pattern also makes it easy to identify support and resistance levels which can be used to enter short positions.
Now that you’ve learned how to trade using the stair steps pattern with the trendline, try this strategy on your IQ Options practice account today. We’d love to hear your views about this strategy in the comments section below.
Good luck!
Top 5 Trending
In the world of online trading — often filled with risk and uncertainty — verifying the credibility of a platform… [Read More]
Starting your trading journey can feel overwhelming — there are countless assets to choose from, and it’s hard to know… [Read More]
"Why do I keep losing money in trading?" This is a question every trader has asked at some point. Experiencing… [Read More]
Trading indices is more than just a financial pursuit; it's both an art and science, demanding attention to detail, a… [Read More]
Forget Tiffany’s—there’s a diamond that traders treasure even more. Diamond chart patterns may not sit on a ring, but they… [Read More]


