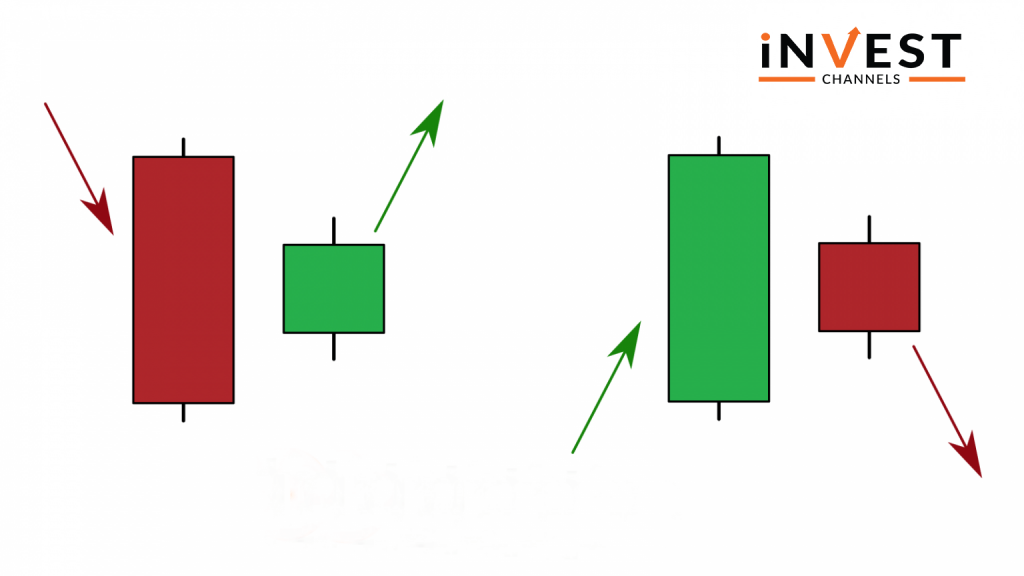
Harami is a Japanese word meaning pregnant woman. When trading using Japanese candles, these are a pair of one long candle immediately followed by a shorter candle of the opposite type. Harami candles are considered a good way to determine a possible trend reversal.
The Harami candle pairs

As mentioned, Harami candles appear in pairs. This is usually close to the end of an uptrend or downtrend.
The first candle that appears is a large long one. If it’s in an uptrend, it will be a large green candle. If the trend was bearish, you’ll first see a large orange candle.
The second candle is a small one of the opposite colour. So if the trend was up, this candle will be short and orange. If the trend was down, this will be a short green candle.

Analyzing Harami Candles
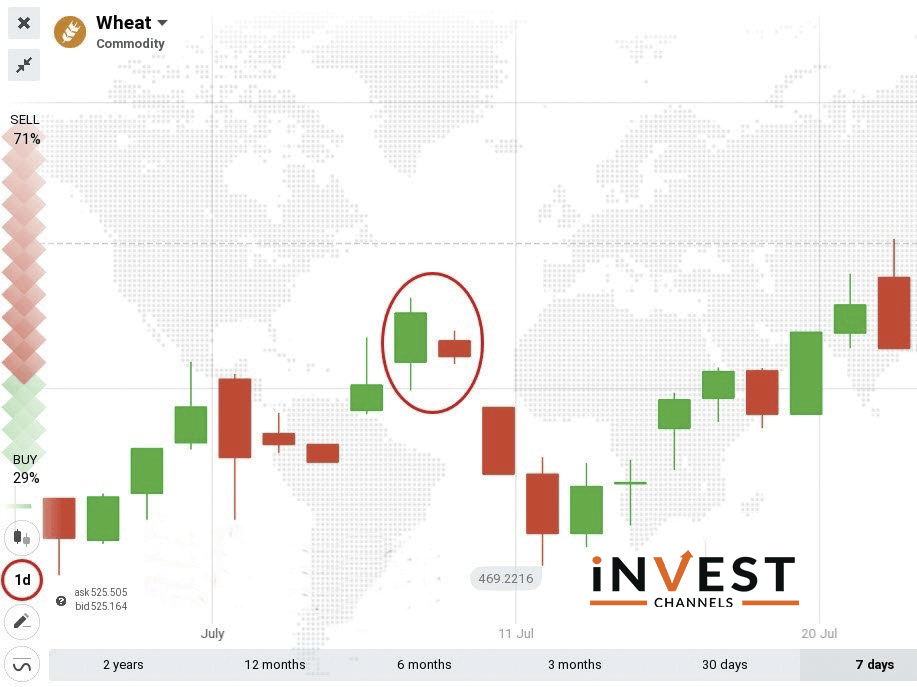
In a clear trend, you’ll find some coloured candles developing one after the other. Longer candles indicate a strong trend. An opposite colour candle signals a trend reversal. What makes Harami candles special is that the opposite colour candle is smaller than the previous candle. In addition, it usually develops within the opening and closing of the previous candle. This is an indicator of a possible reversal. It might also indicate that price correction is imminent before the trend continues in the same direction.
How to trade using Harami candles on IQ Option

The Harami candles are best used when trading for longer periods. In the example above, each candle develops over 1 day. So when the Harami candle pair appears the easiest place to enter a position is when the third, orange candle starts developing. This is a clear indicator that the trend is heading down. The most appropriate trade expiry should be set at 1 day. The reason for this is that you don’t know for sure if the downtrend will continue or if this is simply a price correction.
Now that you know how to analyze and use Harami candles, try using them in your IQ Option account. Then share your results in the comments section below.
Good luck!
Top 5 Trending
"Why do I keep losing money in trading?" This is a question every trader has asked at some point. Experiencing… [Read More]
Trading indices is more than just a financial pursuit; it's both an art and science, demanding attention to detail, a… [Read More]
Forget Tiffany’s—there’s a diamond that traders treasure even more. Diamond chart patterns may not sit on a ring, but they… [Read More]
The Psychological Line (PSY) Indicator is a versatile, oscillator-type trading tool that compares the number of periods with positive price… [Read More]
Have you ever felt like your trading approach could benefit from a little extra energy? That’s where the Relative Vigor… [Read More]


